| AWK | Aho, Weinberger, Kernighan |
| CBL | Composite Blocking List |
| CLI | Command Line Interface |
| CPU | Central Processing Unit |
| CRL | Certificate Revocation List |
| CSV | Comma Separated Values |
| DB | Data Base |
| DER | Distinguished Encoding Rules |
| DJB | Daniel Julius Bernstein |
| DNS | Domain Name Service |
| FQDN | Fully Qualified Domain Name |
| FTP | File Transfer Protocol |
| GB | Gigabyte |
| GBit | Gigabit |
| GMP | GNU Multiple Precision |
| GUI | Graphical User Interface |
| HTML | Hypertext Markup Language |
| ICMP | Internet Control Message Protocol |
| IDS | Intrusion Detection System |
| IO | Input Output |
| IP | Internet Protocol |
| IPS | Intrusion Prevention system |
| IPV4 | Internet Protocol Version 4 |
| IPV6 | Internet Protocol Version 6 |
| IT | Information Technology |
| JSON | Javascript Object Notation |
| NIC | Network Interface Card |
| OS | Operating System |
| PEM | Privacy Enhanced Mail |
| PKCS1 | Public Key Cryptography Standards 1 |
| PKI | Public Key Infrastructure |
| RAID | Redundant Array of Independent Disks |
| RAM | Randon Access Memory |
| RBL | Relay Black List |
| REST | Representational State Transfer |
| RNG | Random Number Generator |
| RSA | Rivest, Shamir and Adleman |
| SHA1 | Secure Hash Algorithm 1 |
| SNI | Server Name Indication |
| SOHO | Small Office Home Office |
| SPOF | Single Point Of Failure |
| SQL | Structured Query Language |
| SSD | Solid State Disk |
| SSL | Secure Socket Layer |
| TCL | Tool Command Language |
| TCP | Tranmission Control Protocol |
| TK | ToolKit |
| TLS | Transport Layer Security |
How to collect as much as possible RSA based public keys and managing the data in a way to have a longterm consistent and repeatable dataset to support the planned security service in an efficient way?
The American mathematician and popular science writer Martin Gardner published in August 1977 in the journal “Scientific American” a number with 129 digits which was a product of two prime numbers. The number was 114 381 625 757 888 867 669 235 779 976 146 612 010 218 296 721 242 362 562 561 842 935 706 935 245 733 897 830 597 123 563 958 705 058 989 075 147 599 290 026 879 543 541 and he left the exercise to the reader’s community to find the two prime factors. The factors were found 16 years later in April 1994 whereas ca. 600 volunteers managed the calculation many days and nights distributed organized via the Internet using the software written by Arjen K. Lenstra from Bell Communications Research Center[6].
Is it possible to get and manage a large number of RSA certificates and factoring the public keys of these certificates into primes in a time range which is smaller than the validity of a certificate?
Encrypt message m with public key e:
E(e, m) = me mod n = c
Decrypt message c with private key d:
D(d, c) = cd mod n = m
Public key is defined as n, e, it is transferred to the encrypting partner.
Private key is defined as n, d, it is never disclosed.
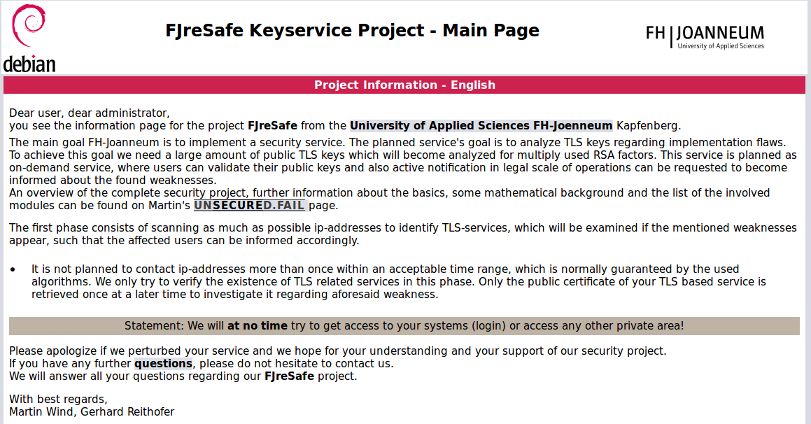
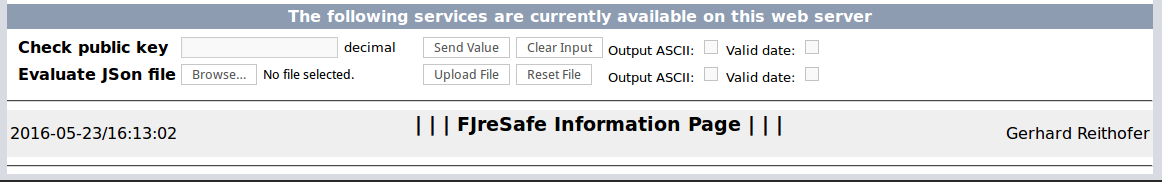
FJreSafe
which is a shortcut for FH-Joanneum Real Enhanced Security Application For Endusers
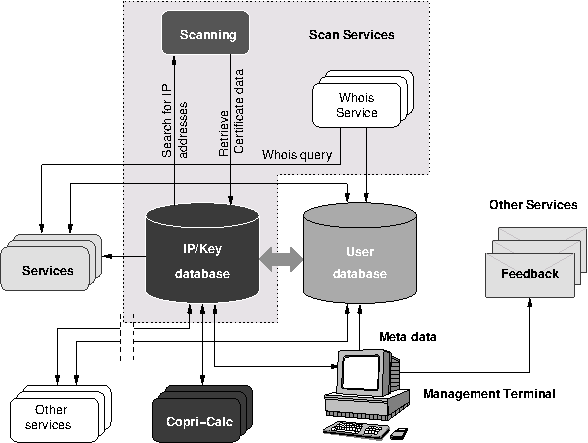
The Network Service provides for the transparent transfer of data (i.e. NS-user-data) between NS users. It makes invisible to these NS users the way in which supporting communications resources are utilized to achieve this transfer[15].
The Internet-Wide Scan Data Repository is a public multi-institutional archive of research data collected through active scans of the Internet that I am leading. The repository was founded as a collaboration between the University of Michigan and Rapid7 and currently hosts several terabytes of data including our regular scans of the HTTPS ecosystem, copies of the root HTTP pages, comprehensive reserve DNS lookups, and banner grabs from dozens of other protocols[32].
Censys is a search engine that allows computer scientists to ask questions about the devices and networks that compose the Internet. Driven by Internet-wide scanning, Censys lets researchers find specific hosts and create aggregate reports on how devices, websites, and certificates are configured and deployed[29].
$ cat 20150209_hosts_uniq|while read IP
do echo "quit"|openssl s_client -connect $IP:443 1>xfer_${IP}_443.out 2>xfer_${IP}_443.err
done
$ ./sta/stats_xfer.sh
7622 handshakes, bytes read: 19363.3KB, wrote: 3962.29KB
this is avg. of 2601.42 bytes read and 532.326 bytes wrote per conn
smallest rsize: 538, largest rsize: 31441
smallest wsize: 186, largest wsize: 912
2.6(Kb)/(IP) × 3550(IP)/(sec) × (7622)/(10000) ≊ 7035(Kb)/(sec) ≊ 7.0(Mb)/(sec)
Preclusion: Special setups which use the TLS extension SNI↓[8] are not taken into account. The main reason is that this extension requires a relatively complex handshake because the certificates are bound to a FQDN↓ instead of a server address. These host names cannot be handled in a way like a clear defined gap less list of 4-byte integer numbers in case of IPV4 addresses which can be retrieved by a mathematical algorithm and which have also mathematically defined boundaries.
From a known server name it is necessary to do a DNS↓ lookup for getting the IP address, using this address the connection can be made, i. e. the standard procedure for address bound services. To get a server specific certificate (virtual hosting) the requested server name must be transferred to the server (server_name-Parameter) to get the corresponding certificate.
Furthermore also the upcoming IPV6↓ addresses are not supported by the project. The reasons are that the IPV6 address range is far beyond of a full scan range (it uses 128 bit addressing) and the majority of publicly available servers still use IPV4. Another argument against SNI is that no specification for IPV6 exists. Therefore IPV6 is often proposed as future-proof solution in multi-server environments.
postgres=# create user keymaster with SUPERUSER LOGIN password 'secret';
CREATE ROLE
postgres=# create database keyservice with owner=keymaster;
CREATE DATABASE
keyservice=# \i sql/keyservice_inst.sql
CREATE TABLE
ALTER TABLE
 ...
INSERT 0 1
INSERT 0 1
git://github.com/zmap/zmap.git
sudo apt-get install build-essential cmake libgmp3-dev libpcap-dev gengetopt byacc flex

cmake -DENABLE_DEVELOPMENT=OFF -DWITH_JSON=OFF
make
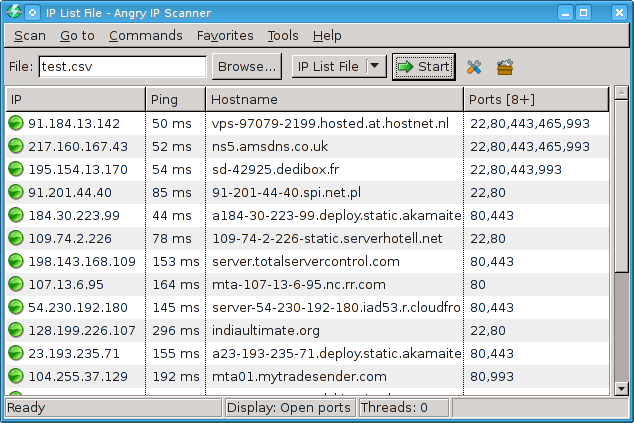
Java based multi-threaded Open Source scanner (http://sourceforge.net/projects/ipscan/) with good performance and scalability.
$ tclsh 0.5/scan_sequence.tcl
New scanning table offset is 51911, 2048 records written to job table ’51911_2048’
Saved results to /net/pub/ASE/2015SS/MasterThesis/Software/keyservice/dat/51911_2048.csv
2048 IPs scanned in 00:00:66 (31.0/sec), 2038 SSL related IPs (99.51%) found (30.88/sec)
| job | start | end | blksize | secs | ips/sec | found | found/sec | % | traffic |
| 104135 | 10:35:24 | 10:36:14 | 2048 | 50 | 41.0 | 33 | 0.66 | 1.61 | 3572964 |
| 106183 | 10:35:25 | 10:36:18 | 2048 | 53 | 38.6 | 32 | 0.60 | 1.56 | 3730304 |
| 108231 | 10:35:26 | 10:36:24 | 2048 | 58 | 35.3 | 32 | 0.55 | 1.56 | 3785842 |
| 110279 | 10:35:27 | 10:36:22 | 2048 | 53 | 38.6 | 29 | 0.55 | 1.42 | 3547280 |
| summary | 10:35:24 | 10:36:24 | 8192 | 60 | 136.5 | 126 | 2.10 | 1.66 | 238 kB/sec |
| addresses | secs | cores | threads | ips/sec | found | found/sec | % | remarks |
| 8192 | 60 | 4 | 256 | 136.5 | 129 | 2.15 | 1.57 | port 80 only |
| 8192 | 63 | 2 | 1024 | 130.0 | 137 | 2.17 | 1.69 | port 80 only |
| 8192 | 72 | 2 | 256 | 113.7 | 151 | 2.10 | 1.86 | port 80 only |
| 1024 | 60 | 4 | 100 | 17.06 | 24 | 0.40 | 2.34 | 12 ports |
| 1024 | 30 | 2 | 512 | 33.86 | 9 | 0.30 | 0.90 | 5 ports |
| 1024 | 20.4 | 2 | 1024 | 50.20 | 20 | 0.98 | 1.95 | 5 ports |
This is the fastest Internet port scanner. It can scan the entire Internet in under six minutes, transmitting ten million packets per second.It produces results similar to nmap, the most famous port scanner. Internally, it operates more like scanrand, unicornscan, and ZMap, using asynchronous transmission. The major difference is that it’s faster than these other scanners. In addition, it’s more flexible, allowing arbitrary address ranges and port ranges.
ubuntu@ip-172-31-12-170:~/keyservice$ sudo tclsh 0.5/scan_sequence.tcl -n 100000
[80051_100000]: scan job start: 2015-05-25/22:21:27
dat/exclude.conf: excluding 122 ranges from file
Starting masscan 1.0.3 (http://bit.ly/14GZzcT) at 2015-05-25 22:21:41 GMT
 — forced options: -sS -Pn -n --randomize-hosts -v --send-eth
Initiating SYN Stealth Scan
Scanning 86741 hosts [7 ports/host]
[80051_100000]: scan job finished: 2015-05-25/22:22:08
[80051_100000]: approx. traffic: 3798212 bytes
[80051_100000]: 100000 IPs scanned in 00:00:41 (2439.0/sec), 187 SSL related IPs (0.19% - 4.56/sec), 16 certs
| X509 Field | Description |
| issuer dn | The distinguished name (DN) of the certificate issuer |
| subject dn | The distinguished name (DN) of the certificate subject |
| notBefore date | The begin date for the validity of the certificate |
| notAfter date | The expiry date for the validity of the certificate |
| serial h | The serial number of the certificate in hex |
| cipher cipher | The current cipher in use between the client and server channels |
| sbits n | The number of bits used for the session key |
| sha1_hash hash | The certificate hash (not documented in the man page) |
issuer    = CN=TERENA SSL CA 2,O=TERENA,L=Amsterdam,ST=Noord-Holland,C=NL
subject   = CN=www.fh-joanneum.at,OU=Domain Control Validated
notBefore = Apr 24 00:00:00 2015 GMT
notAfter  = May 21 23:59:59 2018 GMT
serial    = 35CEC0A2E87CB615F3B40441AE618809
cipher    = ECDHE-RSA-AES256-SHA384
sbits     = 256
sha1_hash = CD608B55BED51B6E3BDD3805F16E04A50B6F72F5
% package require -exact tls 1.6.4.1
1.6.4.1
% tls::certdata
wrong # args: should be "tls::certdata  ?-cert? ?-pem? ?-der? ?-local? channel"
| X509 Fields | Description |
| chain dn list | Certificate chain according [7] as from-to DN list |
| e h | Exponent for the encryption in hex (refer to 1.2.1↑) |
| d h | Exponent for the decryption in hex (refer to 1.2.1↑) |
| l n | Size of modulus in bits (refer to Section 8.8↓) |
| n h | Modulus of the public key in hex (refer to 1.2.1↑) |
| p h | First private prime factor in hex (not used in public keys) |
| q h | Second private prime factor in hex (not used in public keys) |
| typ text | Key type “rsa” if EVP_PKEY_RSA[21] or omitted |
| version n | X509 certificate version as decimal number |
| cert | Complete X509-certificate in format PEM, DER or raw hex |
cipher    = ECDHE-RSA-AES256-GCM-SHA384
issuer    = CN=RapidSSL SHA256 CA - G3,O=GeoTrust Inc.,C=US
notAfter  = Jun  4 07:26:21 2018 GMT
notBefore = Jul  7 00:14:47 2015 GMT
sbits     = 256
serial    = 058CAA
sha1_hash = C8E632259113CC94BC8F9720455243214FEC7467
subject   = CN=*.hybridserver.at,OU=Domain Control Validated - RapidSSL(R),
            OU=See www.rapidssl.com/resources/cps (c)14,OU=GT18085679
chain     = {/OU=GT18085679/OU=See www.rapidssl.com/resources/cps (c)14\
             /OU=Domain Control Validated - RapidSSL(R)/CN=*.hybridserver.at}
            {/C=US/O=GeoTrust Inc./CN=RapidSSL SHA256 CA - G3}
            {/C=US/O=GeoTrust Inc./CN=RapidSSL SHA256 CA - G3}
            {/C=US/O=GeoTrust Inc./CN=GeoTrust Global CA}
e         = 10001
issuer    = CN=RapidSSL SHA256 CA - G3,O=GeoTrust Inc.,C=US
l         = 2048
n         = A962BE5A7C88D6DD7B7BE622FBE41786E6BB2F0E3205FFA29A6ED5C9EB24E40BE0C8A\
            91D21D9EB392F0662E4D89905B0B57BFB6DFAEFC9551624451C82B78C9D0D11A08736\
            9773AEA3C64F04D488C227E5C8E44D7B0CA55526978F4A6A36A03A0B5D515C51BB93E\
            389D9AFC9653B13A197BA1F22359807153507DF8740D43BD0038D105AF36A187F29F7\
            E00A19BF372110CB338C24D8C601AC31B06AC0C954BF39C652C55E352A2E9F25210B4\
            68E4AC0CDC5943E15EACCF02835439194C1758E71587B489C0A75A4CB7F3EF4A88945\
            F079E7FD6891B4B9A2461C93740ABF729EE3E79BF4378EFEDCFA64226F876C0E261DE\
            30E3BFDD99BEA522C718740258B9F
typ       = rsa
version   = 2
[cluster@bogota l-c]$ time bin/ipshuffle -n 0 -f dat/ipv4shuffle.dat Running loop from 0 to 4294967295 assigned 4294967295 adresses Hello universe, pointer size of iplist=8 Beginning shuffling of 4294967295 addresses ... ...reordered 4294967295 adresses writing 4294967295 records to file ’dat/ipv4shuffle.dat’ sizeof(b_iplist)=5, count=4294967295 21474836475 bytes written to file ’dat/ipv4shuffle.dat’ real 23m18.450s user 20m6.572s sys 1m28.532s
[cluster@bogota l-c]$ cp dat/ipv4shuffle.dat dat/ipv4shuffle.cpy
[cluster@bogota l-c]$ gzip dat/ipv4shuffle.cpy
[cluster@bogota l-c]$ ls -l dat/ipv4shuffle.*
-rw-rw-r-- 1 cluster cluster 21474836475 May 16 16:30 dat/ipv4shuffle.dat
-rw-rw-r-- 1 cluster cluster 19266227740 May 16 16:41 dat/ipv4shuffle.cpy.gz
scan_sequ.tcl -n 1000000 [188538_1000000]: scan job start: 2015-06-07/20:02:42 dat/exclude.conf: excluding 122 ranges from file Starting masscan 1.0.3 (http://bit.ly/14GZzcT) at 2015-06-07 18:51:06 GMT — forced options: -sS -Pn -n --randomize-hosts -v --send-eth Initiating SYN Stealth Scan Scanning 867738 hosts [19 ports/host] [188538_1000000]: scan job finished: 2015-06-07/20:53:10 [188538_1000000]: 1000000 IPs scanned in 00:50:28 (330.3/sec), 155 SSL related IPs (0.02% - 0.05/sec), 20 certs
[80096_1000000]: 1000000 IPs scanned in 00:26:58 (618.0/sec), 359 SSL related IPs (0.04% - 0.22/sec), 17 certs
[80101_1000000]: 1000000 IPs scanned in 00:20:42 (805.2/sec), 331 SSL related IPs (0.03% - 0.27/sec), 16 certs
| Job/ID | IPs | Time | IP/sec | TLS | %TLS | TLS/sec | Certs |
| 80206 | 100 | 00:00:14 | 7.1 | 0 | 0.00 | 0.00 | 0 |
| 80306 | 1000 | 00:00:14 | 71.4 | 3 | 0.30 | 0.30 | 0 |
| 1196306 | 5000 | 00:00:13 | 384.6 | 32 | 0.64 | 0.64 | 0 |
| 81306 | 10000 | 00:00:17 | 769.2 | 48 | 0.48 | 0.48 | 1 |
| 1201306 | 50000 | 00:00:17 | 2941.2 | 240 | 0.48 | 0.48 | 7 |
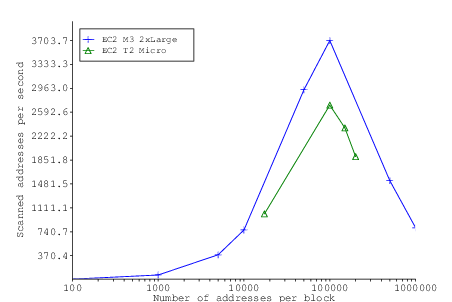
| 91306 | 100000 | 00:00:27 | 3703.7 | 208 | 0.21 | 0.21 | 7 |
| 1251306 | 500000 | 00:05:26 | 1533.7 | 317 | 0.06 | 0.06 | 14 |
| 191306 | 1000000 | 00:20:45 | 803.2 | 316 | 0.03 | 0.03 | 11 |
Job/ID IPs Time IP/sec TLS %TLS TLS/sec Certs CPU 4294950000 17295 00:00:17 1017.4 7 0.04 0.41 7 54% 0001100000 100000 00:36.90 2702.7 697 0.70 18.84 14 64% 0001200000 150000 00:91:04 2348.8 1010 0.67 15.78 16 80% 0000900000 200000 01:45.52 1904.8 1354 0.68 12.90 30 87%
Scan started: 0753700000_100000 2015-08-22/22:28:09
[0753700000_100000]: 100000 IPs scanned in 00:01:41 (990.1/sec), 834 SSL related IPs (0.83% - 8.26/sec),
unknown=1 ssl=5 ssh=10 open=813 db_update=2 db_insert=719 complete=834 X509=5
Scan finished: 0753700000_100000 2015-08-22/22:29:50
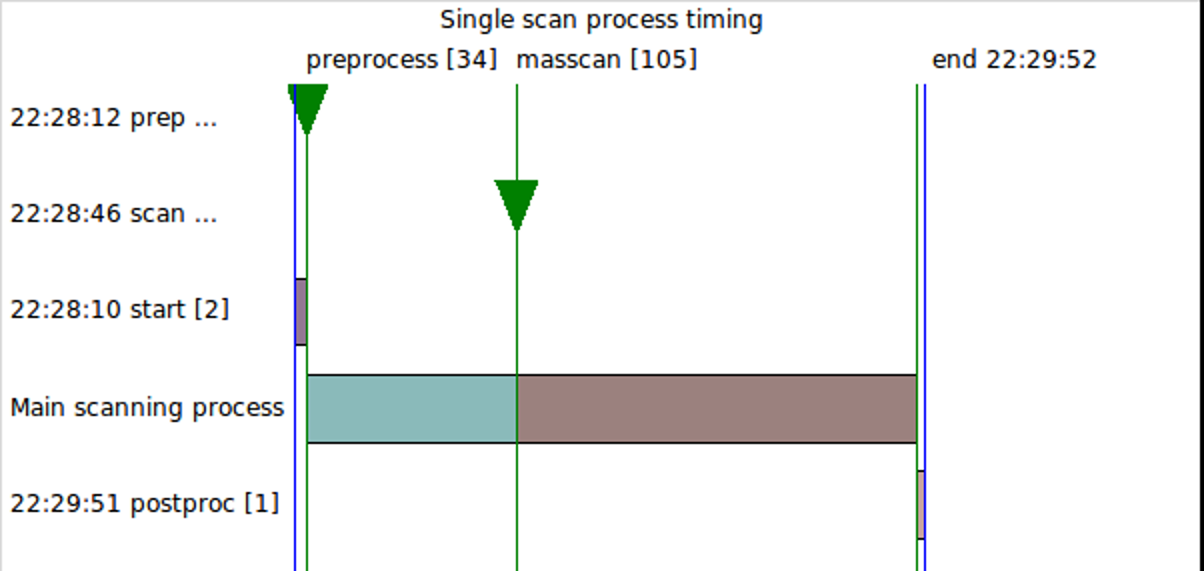
Scan started: 0753800000_100000 2015-08-22/22:28:10
[0753800000_100000]: 100000 IPs scanned in 00:01:42 (980.4/sec), 911 SSL related IPs (0.91% - 8.93/sec),
unknown=1 ssl=4 ssh=4 open=899 db_update=2 db_insert=777 complete=911 X509=3
Scan finished: 0753800000_100000 2015-08-22/22:29:52
| Object | Time | Sec. | Remark |
| Scan job start | 2015-08-22 22:28:10 | 2 | Job ID 0753800000_100000 |
| Temp input finished | 2015-08-22 22:28:12 | 34 | 0753800000_100000.txt (100000 lines) |
| Masscan start | 2015-08-22 22:28:46 | 105 | reported 20:28:46, timezone corr. |
| Temp output finished | 2015-08-22 22:29:51 | 1 | 0753800000_100000.csv (913 lines) |
| Log file closed | 2015-08-22 22:29:52 | scan_20150822_10000__1_7306.log | |
| Scan job end | 2015-08-22 22:29:52 | overall runtime: 102 sec. (00:01:42) |
SECS=60;START=$(cat dat/ipv4shuffle_20150624.seq);\
sleep $SECS; ENDE=$(cat dat/ipv4shuffle_20150624.seq); \
RES=$(echo "scale=3; ($ENDE-$START)/$SECS" | bc); echo $RES $ENDE-$START $RES
while true; do
  psql -h localhost -U keymaster -d keyservice -c \
	"select now(),value from seq_table where name=’next_scanval’;"|\
	 sed -n ’3,3p’|tee -a log/retrieve_seq_$(date +%Y-%m-%d).log
  sleep 300
done
 2015-08-25 23:15:17.987979+02 | 47640
 2015-08-25 23:20:18.526297+02 | 132140
 2015-08-25 23:25:19.062381+02 | 218840
 2015-08-25 23:30:19.289489+02 | 294940
 2015-08-25 23:35:19.51653+02 | 382940
 2015-08-25 23:40:19.650092+02 | 474440
 2015-08-25 23:45:19.88909+02 | 558640
 2015-08-25 23:50:20.219764+02 | 648040
 2015-08-25 23:55:20.41744+02 | 738340
awk ’{if (NR==1) {old=$NF; next} new=$NF; dif=(new-old)/300.0; sum+=dif; old=new;}
    END{print "Average value: " sum/(NR-1) " svcs/sec."}’ log/retrieve_seq_2015-08-25.log
Average value: 287.792 svcs/sec.
select count(*),to_char(seen_at, ’YYYY-MM-DD HH24’) from scan
  where seen_at >= ’2015-08-21 00:00:00’
  group by to_char(seen_at, ’YYYY-MM-DD HH24’)
  order by to_char(seen_at, ’YYYY-MM-DD HH24’);
./0.7/scan_sequ.tcl &
./0.7/scan_sequ.tcl &
./0.7/scan_sequ.tcl &
while true
do sudo ./0.7/scan_sequ.tcl -n 10000 &
   sleep 6 # wait time in seconds
done
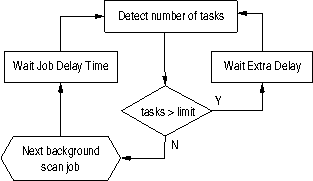
num_procs()
{ # $1 ..taskname
  ps -ef|grep "$1"|egrep -vw "grep|sudo|$0"|wc -l
}
SCANJOB_SIZE=100000 # number of scan records per job
MAX_SCAN_SEQ=10000  # number of scan jobs
JOBWAIT_TIME=0.7    # wait seconds between jobs
EXTRA_DELAY=10      # wait if task limit is reached
JOB_LIMIT=25        # maximum number of parallel jobs
JOB_NUMBER=1        # job loop counter
JOB_NAME="./0.8/scan_sequ.tcl"
while [ $JOB_NUMBER -lt $MAX_SCAN_SEQ ]
do RUN_JOBS=$(num_procs $JOB_NAME)
   if [ $RUN_JOBS -gt $JOB_LIMIT ]
   then sleep $EXTRA_DELAY; continue
   fi
   sudo $JOB_NAME -n $SCANJOB_SIZE & # must be run as root
   sleep $JOBWAIT_TIME
   JOB_NUMBER=$(($JOB_NUMBER+1))
done
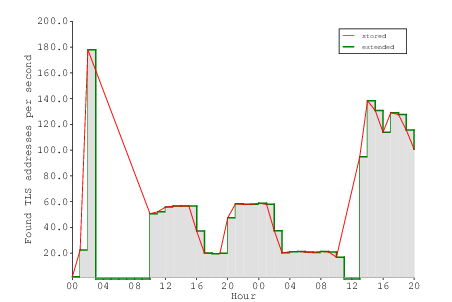
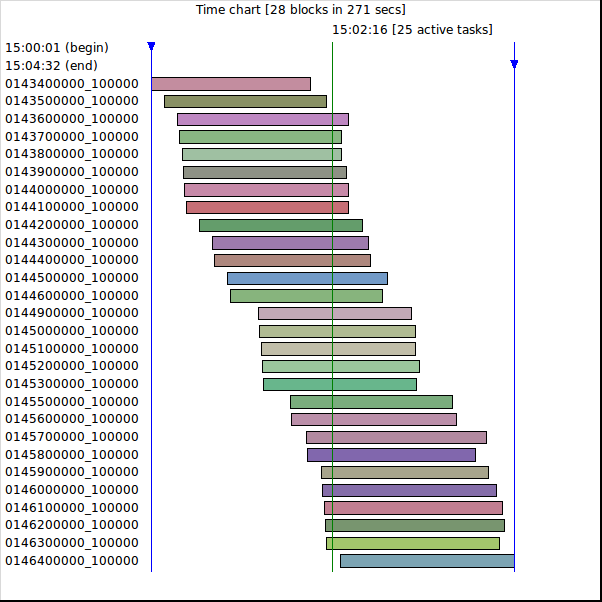
$ sta/stats_parscan.sh -b "2015-08-22 15:00:00" -e "2015-08-22 15:02:30"
=====================================================================================================
       From                 Until         BlkSize   Time  IPs/sec  SSL  %SSL SSL/sec   Scan ID
-----------------------------------------------------------------------------------------------------
2015-08-22 15:00:01  2015-08-22 15:02:00  100000  00:01:59  840.3  554  0.55  4.66  0143400000_100000
2015-08-22 15:00:11  2015-08-22 15:02:12  100000  00:02:01  826.4  528  0.53  4.36  0143500000_100000
2015-08-22 15:00:21  2015-08-22 15:02:28  100000  00:02:07  787.4  642  0.64  5.06  0143600000_100000
...
2015-08-22 15:02:12  2015-08-22 15:04:21  100000  00:02:09  775.2  540  0.54  4.19  0146300000_100000
2015-08-22 15:02:22  2015-08-22 15:04:32  100000  00:02:10  769.2  666  0.67  5.12  0146400000_100000
-----------------------------------------------------------------------------------------------------
     Scan start             Scan end      Blocks  IPs tot.  SSL rel.  Scan time   IPs/sec  SSL/sec
2015-08-22 15:00:01  2015-08-22 15:04:32  36938   2800000   19873    0d 00:04:31  10332.1   73.3
=====================================================================================================
Entity type Implementation Stored in Level I scan address Randomized Linear IP-Table Plain file Level I - TLS address Sequence key “next_scanval” Database Level II - retrieve cert Sequence key “next_rsa_val” Database Exported address Sequence key “next_export” Database Joining RSA cert ID Sequence key “next_joinval” Database Table 6.6 Sequence handling methods
SYN scan is the default and most popular scan option for good reasons. It can be performed quickly, scanning thousands of ports per second on a fast network not hampered by restrictive firewalls. It is also unobtrusive and stealthy since it never completes TCP connections.[12]
A dedicated scalable server solution with a bandwidth of one GBit.
The product performance should be in a medium power class.
A possible scalability up to ten nodes should be considered.
$ apt-get install postgresql tcl-8.6 tk-8.6 libpgtcl
keymaster@d10162:~/keyservice$ sudo ./0.5/scan_sequ.tcl
Module masscan successfully loaded
Pre-Action: 2048 records written to input file /home/keymaster/keyservice/tmp/8194_2048.txt
dat/exclude.conf: excluding 123 ranges from file
Starting masscan 1.0.3 (http://bit.ly/14GZzcT) at 2015-06-23 20:38:18 GMT
 — forced options: -sS -Pn -n --randomize-hosts -v --send-eth
Initiating SYN Stealth Scan
Scanning 1655 hosts [19 ports/host]

Exec-Scan finished, 1 results written to /home/keymaster/keyservice/tmp/8194_2048.csv
Post-Action: 51 results found
[8194_2048]: 2048 IPs scanned in 00:00:14 (146.3/sec), 51 TLS related IPs (2.49% - 3.64/sec), ssl=1 open=49 X509=1
Database error: Connection to database failed
FATAL:  sorry, too many clients already
max_connections = 2000
shared_buffers = 12GB
effective_cache_size = 36GB
work_mem = 3145kB
maintenance_work_mem = 2GB
checkpoint_segments = 32
checkpoint_completion_target = 0.9
wal_buffers = 16MB
default_statistics_target = 100
top - 12:51:38 up 10:34, 2 users, load average: 12,13, 13,30, 13,32
Tasks: 267 total, 9 running, 258 sleeping, 0 stopped, 0 zombie
%Cpu(s): 40,2 us, 19,9 sy, 0,0 ni, 36,5 id, 0,6 wa, 0,0 hi, 2,8 si, 0,0 st
KiB Mem: 49561972 total, 26309436 used, 23252536 free, 94336 buffers
KiB Swap: 50331624 total, 0 used, 50331624 free. 24012900 cached Mem
PID USER PR NI VIRT RES SHR S %CPU %MEM TIME+ COMMAND
2042 root 20 0 340316 179164 4292 S 118,7 0,4 0:37.56 masscan64
2098 root 20 0 340316 179156 4292 S 118,7 0,4 0:30.74 masscan64
2087 root 20 0 340308 179156 4292 S 112,5 0,4 0:31.35 masscan64
2121 root 20 0 17792 2860 1992 R 100,0 0,0 0:23.13 masscan64
2128 root 20 0 17788 2824 1964 R 100,0 0,0 0:19.37 masscan64
2156 root 20 0 17792 2860 1996 R 100,0 0,0 0:11.54 masscan64
2165 root 20 0 17280 2600 1992 R 100,0 0,0 0:07.68 masscan64
2182 root 20 0 17276 2604 1996 R 100,0 0,0 0:03.55 masscan64
2191 root 20 0 52420 19776 3500 R 100,0 0,0 0:00.80 tclsh
2138 root 20 0 17788 2868 1996 R 93,7 0,0 0:15.49 masscan64
2035 root 20 0 340312 179148 4292 S 37,5 0,4 0:40.51 masscan64
2049 root 20 0 340316 179152 4292 S 25,0 0,4 0:37.90 masscan64
2108 root 20 0 20192 3708 2180 R 25,0 0,0 0:24.98 masscan64
3 root 20 0 0 0 0 S 12,5 0,0 75:08.77 ksoftirqd/0
2194 keymast+ 20 0 23780 3012 2448 R 6,2 0,0 0:00.01 top
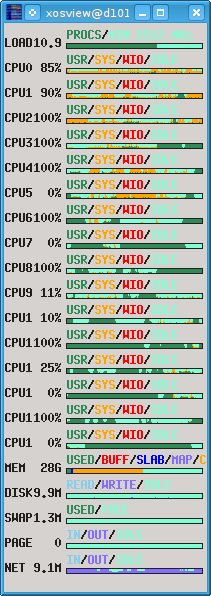
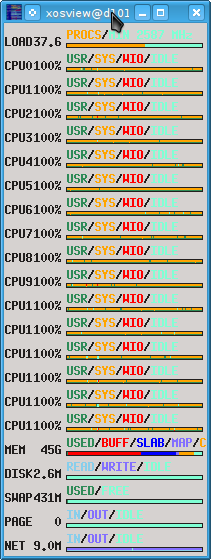
13399 keymast+ 20 0 35212 4648 4092 S 6,2 0,0 0:38.22 xosview
1 root 20 0 28768 4996 3112 S 0,0 0,0 0:02.07 systemd
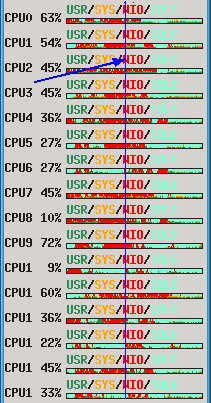
top - 21:39:18 up 27 days,  2:57,  2 users,  load average: 36,72, 37,30, 37,63
Tasks: 300 total,  38 running, 262 sleeping,   0 stopped,   0 zombie
%Cpu0  : 45,4 us, 53,6 sy,  0,0 ni,  0,0 id,  0,0 wa,  0,0 hi,  1,0 si,  0,0 st
%Cpu1  : 41,6 us, 58,4 sy,  0,0 ni,  0,0 id,  0,0 wa,  0,0 hi,  0,0 si,  0,0 st
%Cpu2  : 41,1 us, 57,9 sy,  0,0 ni,  1,0 id,  0,0 wa,  0,0 hi,  0,0 si,  0,0 st
%Cpu3  : 45,2 us, 53,8 sy,  0,0 ni,  0,7 id,  0,0 wa,  0,0 hi,  0,3 si,  0,0 st
%Cpu4  : 43,8 us, 55,6 sy,  0,0 ni,  0,7 id,  0,0 wa,  0,0 hi,  0,0 si,  0,0 st
%Cpu5  : 44,1 us, 55,9 sy,  0,0 ni,  0,0 id,  0,0 wa,  0,0 hi,  0,0 si,  0,0 st
%Cpu6  : 42,6 us, 54,5 sy,  0,0 ni,  2,6 id,  0,0 wa,  0,0 hi,  0,3 si,  0,0 st
%Cpu7  : 44,6 us, 55,1 sy,  0,0 ni,  0,3 id,  0,0 wa,  0,0 hi,  0,0 si,  0,0 st
%Cpu8  : 43,0 us, 57,0 sy,  0,0 ni,  0,0 id,  0,0 wa,  0,0 hi,  0,0 si,  0,0 st
%Cpu9  : 41,9 us, 58,1 sy,  0,0 ni,  0,0 id,  0,0 wa,  0,0 hi,  0,0 si,  0,0 st
%Cpu10 : 43,9 us, 55,8 sy,  0,0 ni,  0,0 id,  0,3 wa,  0,0 hi,  0,0 si,  0,0 st
%Cpu11 : 40,5 us, 59,2 sy,  0,0 ni,  0,3 id,  0,0 wa,  0,0 hi,  0,0 si,  0,0 st
%Cpu12 : 42,8 us, 57,2 sy,  0,0 ni,  0,0 id,  0,0 wa,  0,0 hi,  0,0 si,  0,0 st
%Cpu13 : 57,6 us, 42,4 sy,  0,0 ni,  0,0 id,  0,0 wa,  0,0 hi,  0,0 si,  0,0 st
%Cpu14 : 44,1 us, 55,9 sy,  0,0 ni,  0,0 id,  0,0 wa,  0,0 hi,  0,0 si,  0,0 st
%Cpu15 : 43,9 us, 56,1 sy,  0,0 ni,  0,0 id,  0,0 wa,  0,0 hi,  0,0 si,  0,0 st
| case # | port 443 only #1 | 9 ports (not 443) #2 | #2/#1 | Remark |
| Scan start | 2015-08-21 10:08:22 | 2015-08-22 13:03:55 | ||
| Scan end | 2015-08-22 12:41:18 | 2015-08-24 13:19:22 | ||
| Blocks | 47236 | 36938 | 0.782 | |
| IPs tot. | 4059017295 | 3270700000 | 0.806 | |
| TLS rel. | 3575192 | 22936589 | 6.415 | Probably TLS |
| Scan time | 1d 02:32:56 |
2d 00:15:27 |
1.811 | |
| IPs/sec | 42469.0 | 18826.7 | 0.443 | Class A addresses |
| TLS/sec | 37.4 | 132.0 | 3.529 | Class S addresses |
| TLS/1M | 880 |
7010 | 7.966 | 1M=1 million IPs |
| TLS/1M/port | 880 | 778.8 |
0.885 | Specific Rate “R” |
open tcp 8443 104.16.75.86 1463952428
$ ls -lh tmp/basescan_all.out
-rw-r--r-- 1 gerhard users 4.4G May 24 11:29 tmp/basescan_all.out
$ wc tmp/basescan_all.out
 100027755  510113202 4636356608 tmp/basescan_all.out
$ grep -v "^open" tmp/basescan_all.out | wc -l
2959060
$ echo 100027755-2959060|bc
97068695
$ echo "scale=5;97068695/100027755"|bc
.97041
split --lines 1000000 --numeric-suffixes  --suffix-length=3 \
      --additional-suffix=.csv basescan_all.out basescan_all_
$ ls -l tmp/basescan_all*.csv
-rw-r--r-- 1 gerhard users 45795896 Mai 25 00:56 tmp/basescan_all_000.csv
-rw-r--r-- 1 gerhard users 45652295 Mai 25 00:56 tmp/basescan_all_001.csv
-rw-r--r-- 1 gerhard users 46946136 Mai 25 00:56 tmp/basescan_all_002.csv
...
-rw-r--r-- 1 gerhard users 45414386 Mai 25 00:57 tmp/basescan_all_099.csv
-rw-r--r-- 1 gerhard users  1316204 Mai 25 00:57 tmp/basescan_all_100.csv
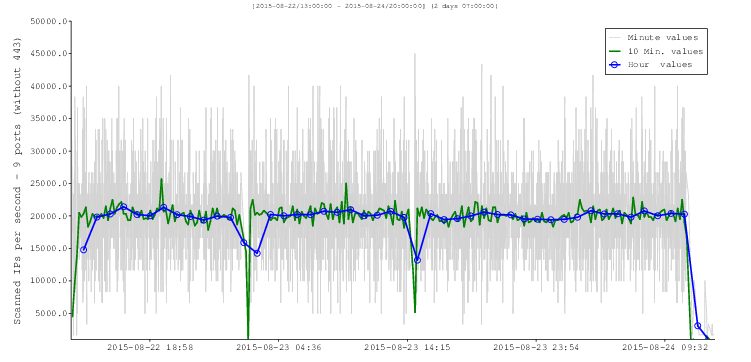
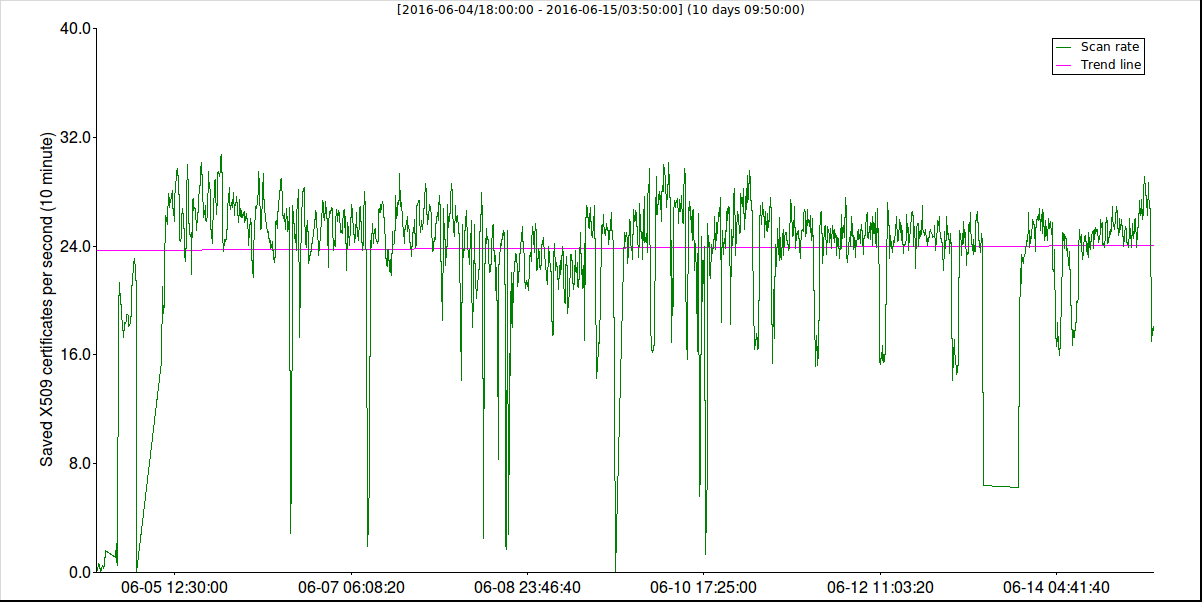
$ utl/select2CSV.sh -o sta/data/seq_mins_group_save.csv "select
  to_char(seen_at,’YYYY-MM-DD HH24:MI’)||’:00’,count(*)/60.0
  from scan where seen_at<=’2016-05-24 11:30:00’
  group by to_char(seen_at,"’YYYY-MM-DD HH24:MI’)
  order by to_char(seen_at,’YYYY-MM-DD HH24:MI’)"
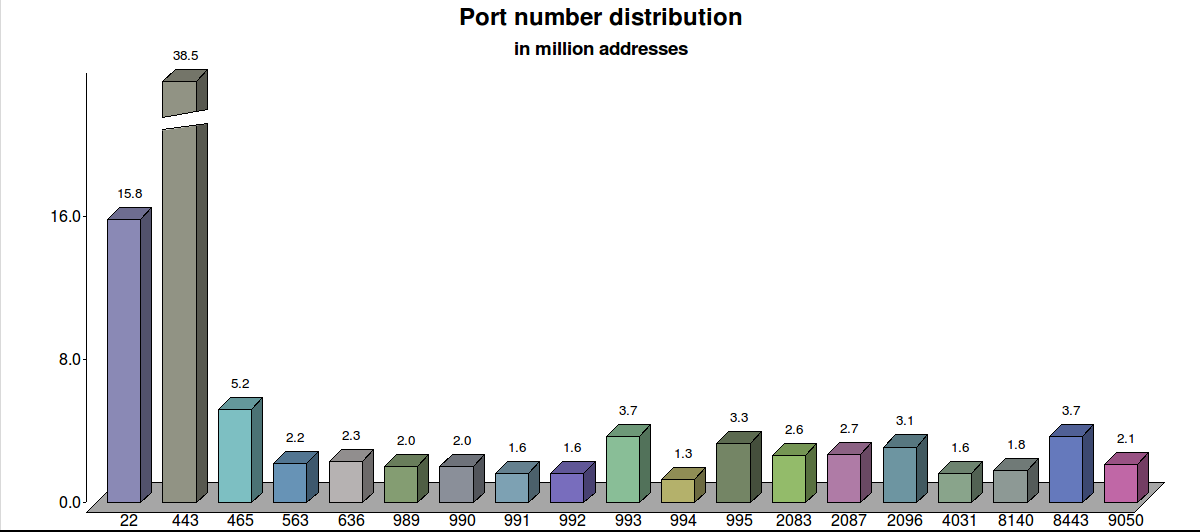
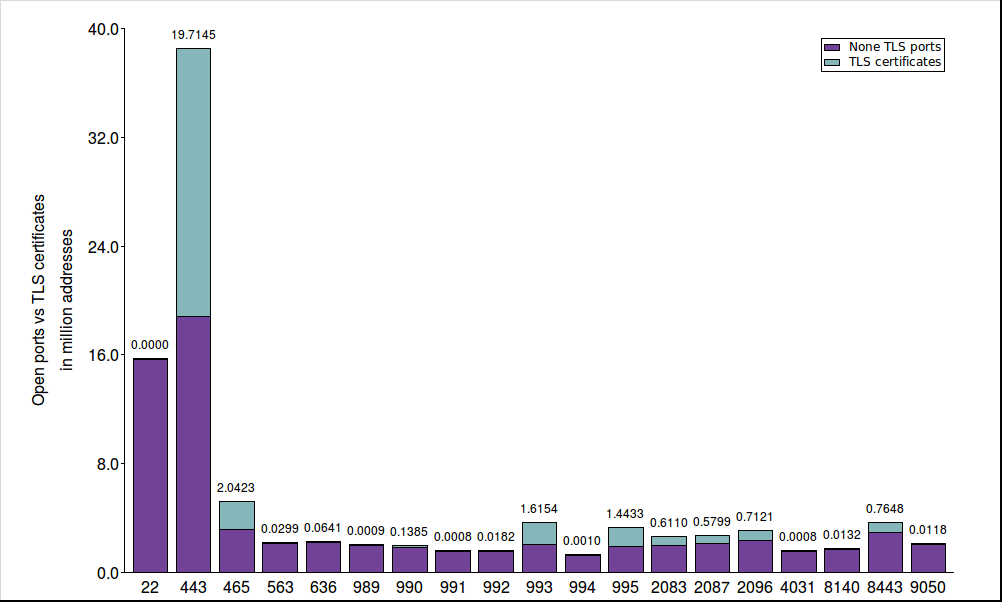
| Port 443 | 38529358 | 39.7% | HTTPS most used TLS service |
| Port 22 | 15753958 | 16.2% | usually not a TLS service |
| Port 465 | 5223677 | 5.4% | |
| other 16 | 42785379 | 31.1% | max. 3.4%, min. 1.3% |
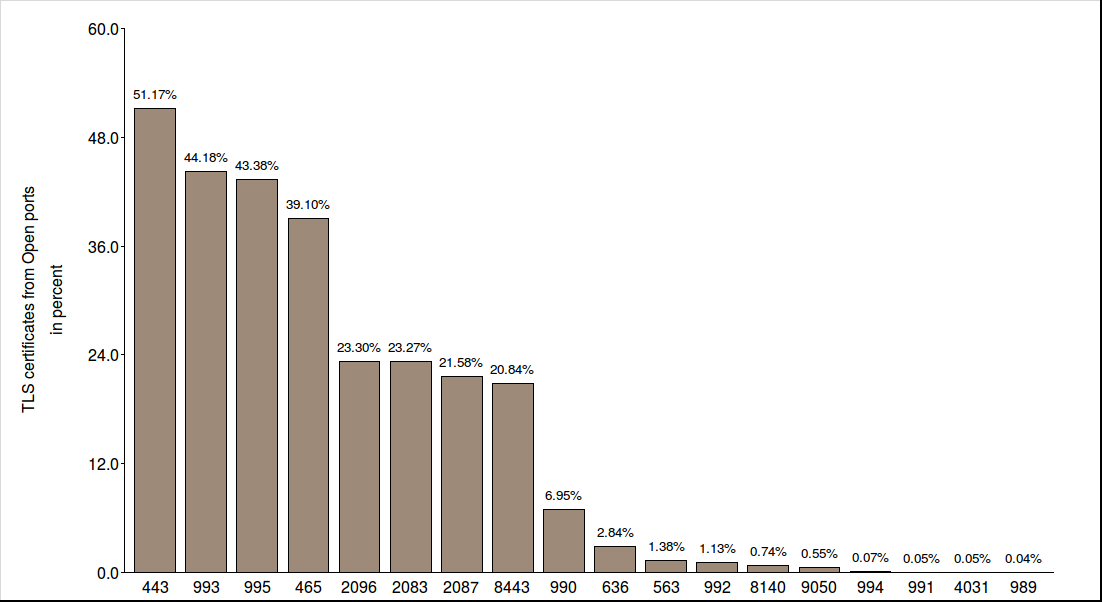
| Port 443 | 38529358 | 47.4% | HTTPS most used TLS service |
| Port 465 | 5223677 | 6.4% | |
| Port 8443 | 3669432 | 4.5% | |
| other 15 | 33892270 | 41.7% | max. 4.5%, min. 1.6% |
$ utl/mark_blocked.sh
--
-- Pipe the following command into PSQL-client
--
update scan set status=’blocked’ where ip_address << ’0.0.0.0/8’;
update scan set status=’blocked’ where ip_address << ’10.0.0.0/8’;
update scan set status=’blocked’ where ip_address << ’100.64.0.0/10’;
 ...
update scan set status=’blocked’ where ip_address << ’66.148.70.0/18’;
update scan set status=’blocked’ where ip_address  = ’203.9.184.0’;
update scan set status=’blocked’ where ip_address  = ’131.242.0.0’;
update scan set status=’blocked’ where ip_address << ’144.39.0.0/16’;
$ utl/mark_blocked.sh | psql -d keyservice -U keymaster -w
UPDATE 0
UPDATE 0
UPDATE 2119
 ...
UPDATE 2443
UPDATE 0
UPDATE 409
UPDATE 415
UPDATE 0
keyservice=# create index on rsa_certs(rsa_n);
ERROR:  index row size 4112 exceeds maximum 2712 for index "rsa_certs_rsa_n_idx"
TIP:  Values larger than 1/3 of a buffer page cannot be indexed.
Consider a function index of an MD5 hash of the value, or use full text indexing.
create index rsa_n_md5_index on rsa_certs(md5(rsa_n));
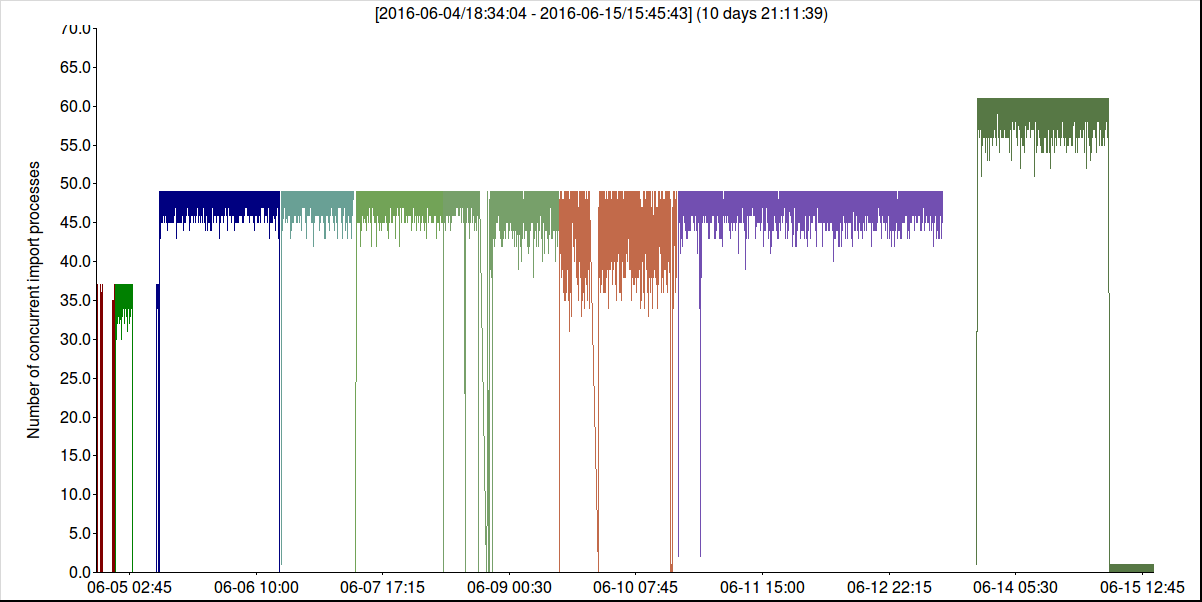
$ utl/select2CSV.sh -o sta/data/rsa_mi10_group_cert.csv "select
  substring(to_char(last_mod,’YYYY-MM-DD HH24:MI’) from 1 for 15)||’0:00’,count(*)/600.0
  from rsa_certs
  where last_mod>=’2016-06-04 18:00:00’ and last_mod<=’2016-06-15 04:00:00’
  group by substring(to_char(last_mod,’YYYY-MM-DD HH24:MI’) from 1 for 15)
  order by substring(to_char(last_mod,’YYYY-MM-DD HH24:MI’) from 1 for 15)"
keyservice=# select count(*) from rsa_certs where last_mod>now()-interval ’1 hour’;
 116814
keyservice=# select count(*) from rsa_certs where last_mod>now()-interval ’1 hour’;
 119029
| Databases | oldservice | keyservice | Remarks | |
| Scan | records | 63205106 | 92797617 | not joined |
| IPs | oldest | 2015-06-23 22:38:19 | 2016-05-22 23:27:08 | |
| newest | 2016-05-24 01:18:25 | 2016-07-19 16:13:10 | ||
| RSA | records | 34882381 | 29476410/62678753 | before/after join |
| certs | oldest | 2015-11-10 21:31:03 | 2016-06-03 15:49:38 | |
| newest | 2015-11-19 11:00:23 | 2016-07-28 10:21:06 | ||
begin: 2016-07-03/20:31:50, end: 2016-07-05/19:51:25, s_scanned=34882381, s_errors=0, s_success=33202343, s_existing=1680038,
    s_runtime=1d 23:19:35.000(170375 sec.)
$ ./0.8/manage_mpz.tcl uniq -c "key_size>=(1024-512) and key_size<(1024+512)" -f dat/uniq_1024d512.mpz
Multi precision MPZ modulus file management module 0.8
Start: 2016-07-27/16:08:11
Write a unique key list to file, scanning database ...
Selecting: distinct encode(rsa_n,’hex’) from rsa_certs where key_size>=(1024-512) and key_size<(1024+512) ...
Database time: 01:58:44.730
Found 1832924 distinct public keys values ...
 1832924 records written to file dat/uniq_20160727_1024d512.mpz
Finished: 2016-07-27/18:07:23
Complete runtime: 01:59:12.596
$ 0.8/search_cert.tcl 28497964500720314315253852748641377239911027643203566
93242386469259040543377427409691335750465436363055325436063558485
62745378707354311729884722624381507389954762098287179276194649927
26555556494130303202660162282998414929930218687192328771695920905
11102985901444956062194680115411530825391497498396487460211950816
39756905982108593507486678488570780829236102380673969494392240307
17828723542246638003195344902425463589842288245012196306296586333
05232164500254195749787858857187143040937645294034999331872787151
22792428387184320781937518438974253160530847664566652049663130784
50740022030058381658990290797322362334492551
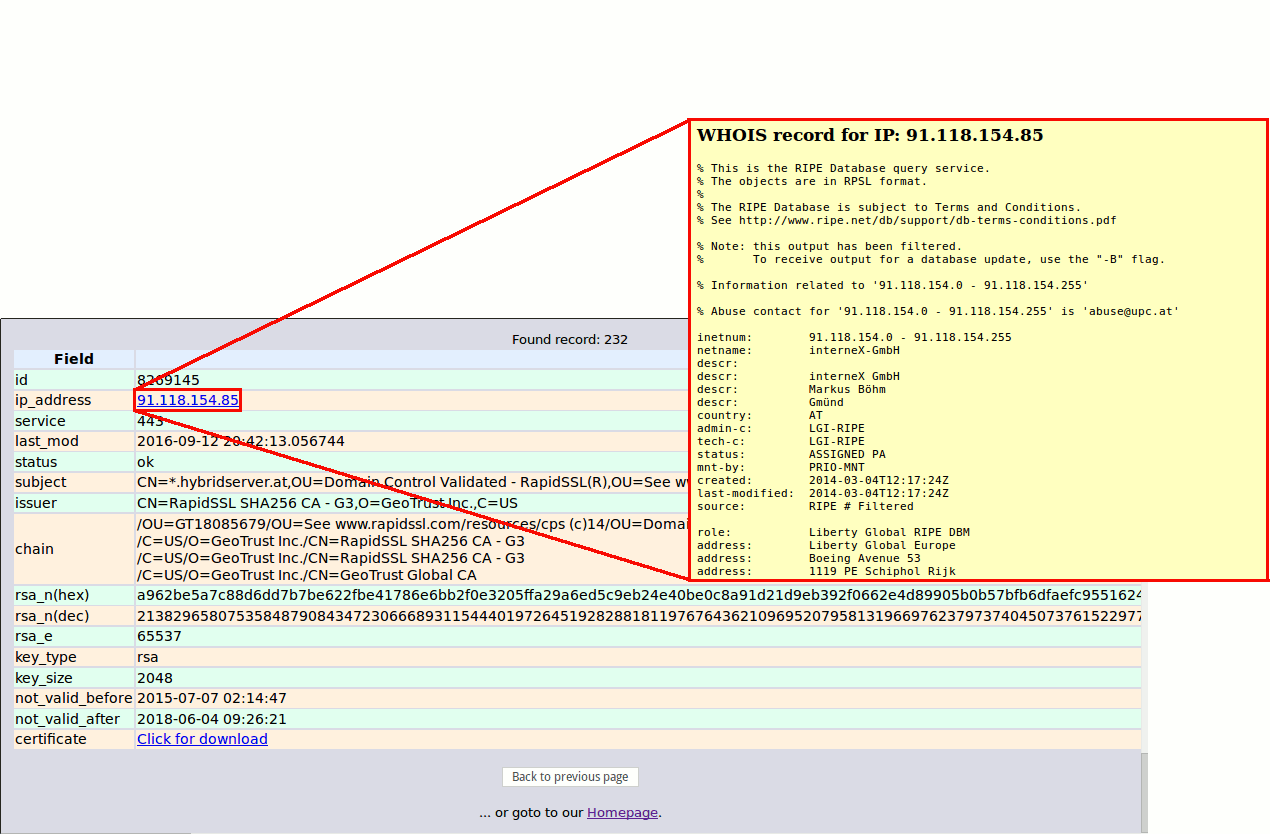
id 64522
ip_address 212.158.128.68
service 443
last_mod 2016-06-04 23:57:19.171095
status ok
subject emailAddress=info@czware.cz,CN=212.158.128.68,OU=QIS,O=CZWARE s.r.o.,L=Prague,ST=Czech Republic,C=CZ
issuer emailAddress=info@czware.cz,CN=212.158.128.68,OU=QIS,O=CZWARE s.r.o.,L=Prague,ST=Czech Republic,C=CZ
chain /C=CZ/ST=Czech Republic/L=Prague/O=CZWARE s.r.o./OU=QIS/CN=212.158.128.68/emailAddress=info@czware.cz
/C=CZ/ST=Czech Republic/L=Prague/O=CZWARE s.r.o./OU=QIS/CN=212.158.128.68/emailAddress=info@czware.cz
rsa_n(hex) e1bf533477b790d87976a759b7f1aae12b5eb6876070e7127ca1dcf1c
e6ef55644bfd4f0585883328a220aa9e6d0477ccf1465cd8f0dbc9aa2e2a5aced
2ec8700415017f250557639c005d7cd61e4053c7f01095570f0beb1ce77b1bdc4
b47b4bc97e80952eabbbd2fd371c1c6792d26492e99b245498652efdc244482f2
5ebb1441898b527ca65fa0e0303b839c6bfea0a62673a5adbef2530e17a0a9f74
83dd14d21a7e05b7f6b6a7df547f08013ce41500d6a6db2a280e7b4f625b92938
3017828bfc6dd3adb5a03d49c1b98dc559ee6c18465fc8cd1c5b6a18d8138e40f
3436f3d330fb927963d692b2987395ab08b5d48998f5d98f0cd740838fa743787
rsa_n(dec) 284979645007203143152538527486413772399110276432035669324
23864692590405433774274096913357504654363630553254360635584856274
53787073543117298847226243815073899547620982871792761946499272655
55564941303032026601622829984149299302186871923287716959209051110
29859014449560621946801154115308253914974983964874602119508163975
69059820859350748667848857078082923610238067396949439224030717828
72354224663800319534490242546358984228824501219630629658633305232
16450025419574978785885718714304093764529403499933187278715122792
42838718432078193751843897425316053084766456665204966313078450740
022030058381658990290797322362334492551
rsa_e 65537
key_type rsa
key_size 2048
not_valid_before 2014-11-04 04:41:15
not_valid_after 2024-11-01 04:41:15
link: ./crt/212/158/128/68/p443.pem
The WHOIS protocol has no provisions for strong security. WHOIS lacks mechanisms for access control, integrity, and confidentiality. Accordingly, WHOIS-based services should only be used for information which is non-sensitive and intended to be accessible to everyone.[23]
Von: infosec-noreply@caltech.edu [mailto:infosec-noreply@caltech.edu] Gesendet: Donnerstag, 25. Dezember 2014 22:46 An: abuse@a1telekom.at Betreff: 178.189.100.130 blocked at caltech.edu 178.189.100.130 was observed probing caltech.edu for security holes. It has been blocked at our border routers. It may be compromised. ...
Keep in mind that the source IP of our client has been sanitized for anonymity.
185.3.232.72:52427 > 10.10.10.40:22
May 22 19:25:10.392348 185.3.232.72.52427 > xxx.xxx.xxx.181.9050: S (src OS: unknown) 518513609:51 8513609(0) win 1024
/var/log/messages:May 23 01:10:15 darknet.superb.net Darknet: 185.3.232.72 exceeded connection attempt threshold
    to tcp:4031 43 times in a 30 minute period
When we perform a host discovery scan, an individual destination address receives at most one probe packet. At this scan rate, a /24-sized network receives a probe packet every 195 s, a /16 block every 0.76 s, and a /8 network block every 3 ms on average.[11]
$ whois 78.46.176.242
...
inetnum:        78.46.0.0 - 78.47.255.255
netname:        DE-HETZNER-20070416
org:            ORG-HOA1-RIPE
descr:          Hetzner Online AG
country:        DE
...
% Information related to ’78.46.0.0/15AS24940’
route:          78.46.0.0/15
descr:          HETZNER-RZ-NBG-BLK5
...
# Abuse Message 1C4CAC21.txt
78.46.0.0/15
keyservice=# select count(*) from scan where ip_address << ’78.46.0.0/15’;
 count
-------
 15585
This IP is infected (or NATting for a computer that is infected) with the Conficker botnet.
More information about Conficker can be obtained from Wikipedia
Remember: Conficker is not a spam sending botnet. It does not send email or spam. It does not use port 25.
Please follow these instructions.
Dshield ...
  count   |    %    |               statustext
----------+---------+-------------------------------------------------------
 40503588 |  43.647 | timeout
 27762510 |  29.917 | ok
 15195367 |  16.375 | blocked
  3026784 |   3.262 | handshake failed: 5 attempts
  2983096 |   3.215 | handshake failed: unknown state
  1354009 |   1.459 | handshake failed: unknown protocol
  1197553 |   1.290 | handshake failed: socket is not connected
   267247 |    .288 | wrong algorithm type
   251642 |    .271 | handshake failed: unsupported protocol
   219239 |    .236 |
    12515 |    .013 | handshake failed: sslv3 alert bad record mac
     9190 |    .010 | handshake failed: wrong version number
     6523 |    .007 | handshake failed: unable to find public key parameters
     3071 |    .003 | handshake failed: wrong cipher returned
     2328 |    .003 | handshake failed: dh key too small
...
$ cmd/collect_pubkeys.sh 146.247.90.133 443
Certificate:
    Data:
        Version: 3 (0x2)
        Serial Number: 18441688780213926796 (0xffee0a3cc2f53b8c)
    Signature Algorithm: sha1WithRSAEncryption
        Issuer: C=FR, ST=France, L=Malataverne, O=NOVARC, OU=SI, CN=ocsinventory-ng/emailAddress=laurent.pons@novarc.com
        Validity
            Not Before: Mar  6 14:22:23 2013 GMT
            Not After : Bad time value
$ utl/select2CSV.sh "select ip_address,service from scan where status=’’" -o rescan_20160910.csv
Start: 2016-09-16 14:33:04
219239 rescan_20160910.csv
Finish: 2016-09-16 14:33:45
$ 0.8/retrieve_cert.tcl -i rescan_20160910.csv
keyservice=# select rowcount(’rsa_certs’);
 rowcount
----------
 62678753
(1 row)
keyservice=# select count(*),status from rsa_certs group by status;
    count | status
----------+--------
        4 | sock
 27940718 | ok
        6 | off
 34738026 | imp
(4 rows)
keyservice=# select count(distinct sha1_hash) from rsa_certs; count --------- 8755651 keyservice=# select count(distinct sha1_hash) as distinct, count(*) as complete from rsa_certs where status=’ok’; distinct | complete ---------+---------- 7380876 | 27940718
$ 0.8/manage_mpz.tcl count -f dat/uniq_20160804_1024d512.mpz
Multi precision MPZ modulus file management module 0.8
1832923 records found in file dat/uniq_20160804_1024d512.mpz, size=287190636.
| Multi usage | SHA1 certificate hash vaue |
| 1137249 | D91044D7BAAC4B1695B463D615D60DF796AB6CD7 |
| 909722 | 81D075440534DA06C1ED5AC48351A9A4978648AA |
| 802591 | 455DBB43E5B704272E873AA0623F8DFE1EB399A5 |
| 362813 | 8A4F195A0E66D8AD9A56F6D810C3A0CC1C276932 |
| 256518 | 16D797F4BB60D1C29B43664A50DD54E58B00DEAF |
| 189818 | 160ED722129930BE4A4B452E03CF215E1949DE2E |
| 186700 | D70EB9E71F1EF7BB11EE5DB659A8BB4C2E3ADD0A |
| 148428 | 6B1EDFA2ED15058CA8F8CD41561C3B20E1498C0C |
| 130008 | 9141B50CEE603888DC45F4F285C1C8844FE12221 |
| 127942 | 50433D50E27D25B7C365BAF5896635F0E7CA6D78 |
 ...
NetRange:       99.0.0.0 - 99.127.255.255
CIDR:           99.0.0.0/9
NetName:        SBCIS-SBIS
NetHandle:      NET-99-0-0-0-1
Parent:         NET99 (NET-99-0-0-0-0)
NetType:        Direct Allocation
OriginAS:       AS7132
Organization:   AT&T Internet Services (SIS-80)
RegDate:        2008-02-25
Updated:        2012-03-02
 ...
OrgName:        AT&T Internet Services
OrgId:          SIS-80
Address:        3300 E Renner Rd
Address:        Mailroom B2139
Address:        Attn:IP Management
City:           Richardson
StateProv:      TX
PostalCode:     75082
Country:        US
RegDate:        2000-06-20
Updated:        2016-06-17
 ...
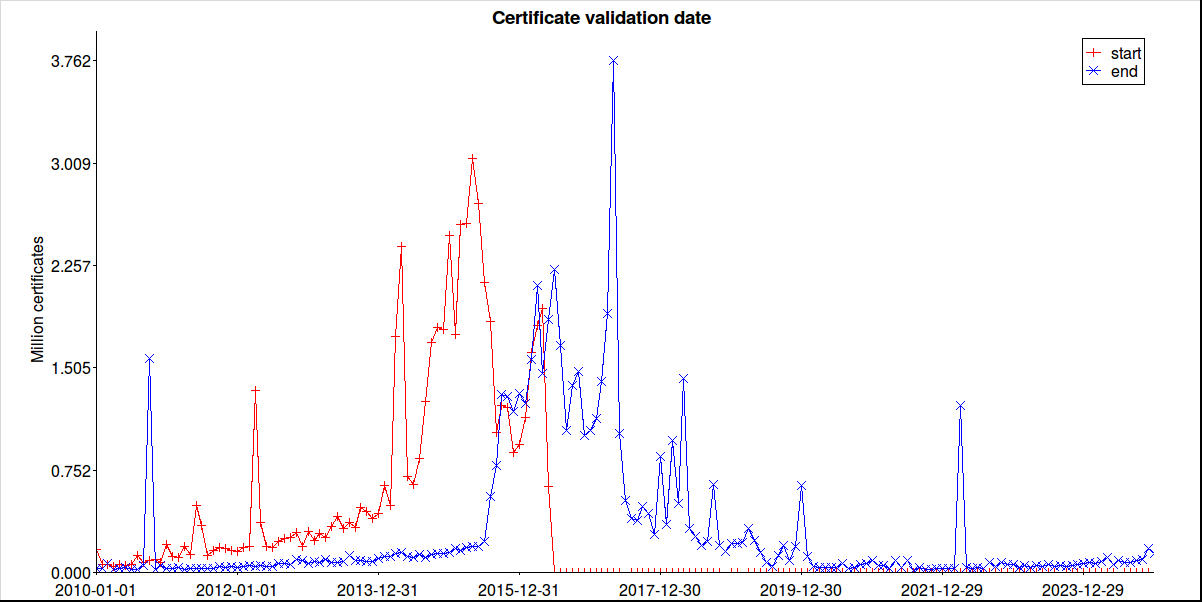
keyservice=# select count(*) from rsa_certs where status=’ok’ and not_valid_after<’2016-06-01’;
 20621461
keyservice=# select count(*) from rsa_certs where status=’ok’ and not_valid_after<now();
 26958220
keyservice=# select count(*) from rsa_certs where status=’ok’ and not_valid_after>=now();
 35741295
select count(*) from rsa_certs where not_valid_before>not_valid_after and status=’ok’;
 14758
not_valid_before<=’2002-12-31’
        1902 |      2
        1903 |      1
        1905 |      1
   ...
        1969 |      2
        1970 | 274579
        1971 |     27
        1972 |      4
   ...
        1997 |     61
        1998 |   3375
        1999 |  10964
        2000 |  49142
        2001 |  15985
        2002 |  21486
not_valid_before>=’2017-01-01’
      2017    35
      2018    32
...
      2164    12
      2165   104
      2558     1
     10000     4
   ip_address    | srvc|  not_valid_before   |   not_valid_after   | lifetime
-----------------+-----+---------------------+---------------------+----------
 54.207.51.132   | 443 | 2016-05-07 00:53:11 | 2016-05-07 00:54:51 | 00:01:40
 54.72.26.74     | 443 | 2016-06-08 02:48:45 | 2016-06-08 02:50:25 | 00:01:40
 54.213.152.140  | 443 | 2016-04-18 00:09:32 | 2016-04-18 00:11:12 | 00:01:40
 64.69.83.250    | 443 | 2016-04-18 00:11:32 | 2016-04-18 00:13:12 | 00:01:40
 212.36.73.146   | 993 | 2016-03-28 16:57:41 | 2016-03-28 17:07:47 | 00:10:06
  ip_address     | srvc|  not_valid_before   |   not_valid_after   |      lifetime
-----------------+-----+---------------------+---------------------+--------------------
 45.123.1.69     | 443 | 2010-01-04 20:13:59 | 2024-12-31 20:13:59 | 5475 days
 66.235.154.1    | 443 | 2010-04-08 14:05:12 | 2024-12-31 01:00:00 | 5380 days 10:54:48
 66.235.154.4    | 443 | 2010-04-15 18:48:53 | 2024-12-31 01:00:00 | 5373 days 06:11:07
 13.91.3.17      | 443 | 2010-05-10 08:00:00 | 2024-12-22 07:00:00 | 5339 days 23:00:00
 104.40.17.48    | 443 | 2010-05-10 08:00:00 | 2024-12-22 07:00:00 | 5339 days 23:00:00
   ip_address    | srvc|  not_valid_before   |  not_valid_after    |       lifetime
-----------------+--- -+---------------------+---------------------+---------------------
 167.121.11.36   | 443 | 2010-04-01 20:39:03 | 9999-12-30 19:39:03 |2918194 days 23:00:00
 167.121.111.201 | 443 | 2010-04-01 20:39:03 | 9999-12-30 19:39:03 |2918194 days 23:00:00
 203.81.25.236   | 443 | 2010-09-09 12:14:50 | 9999-12-31 16:59:59 |2918035 days 04:45:09
 50.240.187.85   | 993 | 2010-12-22 06:45:44 |10000-01-01 00:59:59 |2917931 days 18:14:15
 75.149.217.51   | 443 | 2011-01-17 01:29:33 |10000-01-01 00:59:59 |2917905 days 23:30:26
Sstat(notAfter)  = Dec 31 23:59:59 9999 GMT
Sstat(notBefore) = Jan  4 23:44:33 2015 GMT
Sstat(notAfter)  = Jan 27 18:48:24 2011 GMT
Sstat(notBefore) = Jan 27 18:48:24 2011 GMT
Sstat(notAfter)  = May 24 10:09:43 2016 GMT
Sstat(notBefore) = May 25 10:09:43 2016 GMT
Sstat(notAfter)  = Feb 21 10:21:13 1981 GMT
Sstat(notBefore) = Sep 23 16:49:29 2007 GMT
| # | used count | cipher | % |
| 1 | 17392469 | ECDHE-RSA-AES256-GCM-SHA384 | 27.74 |
| 2 | 9969981 | AES256-SHA | 15.90 |
| 3 | 8752833 | DHE-RSA-AES256-GCM-SHA384 | 13.96 |
| 4 | 7686206 | DHE-RSA-AES256-SHA | 12.26 |
| 5 | 4405751 | ECDHE-RSA-AES128-GCM-SHA256 | 7.02 |
| 6 | 3113879 | RC4-SHA | 4.96 |
| 7 | 2587127 | AES128-SHA | 4.12 |
| 8 | 1916487 | AES256-GCM-SHA384 | 3.05 |
| 9 | 1650812 | ECDHE-RSA-AES256-SHA384 | 2.63 |
| 10 | 1446109 | ECDHE-RSA-AES256-SHA | 2.30 |
int BN_num_bits(const BIGNUM *a);
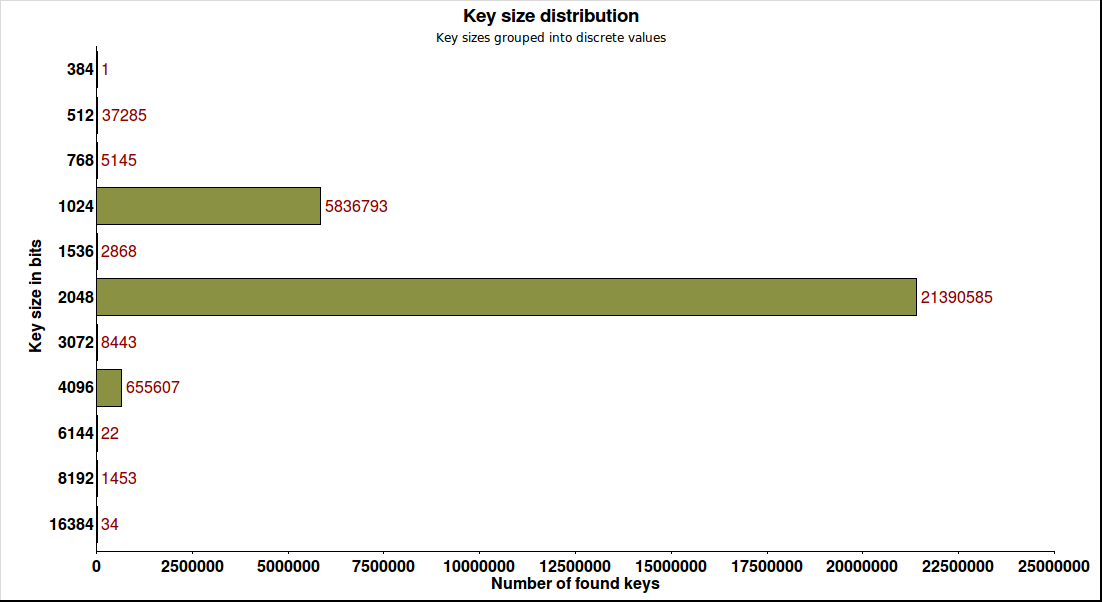
keyservice=# select row_number() over() as "#",* from (select key_size,count(*) from rsa_certs
    where status=’ok’ and key_size is not null group by key_size order by count desc) as "#";
  #  | key_size |  count
-----+----------+----------
   1 |     2048 | 21381173
   2 |     1024 |  5751378
   3 |     4096 |   654857
   4 |     1040 |    60708
   5 |      512 |    37252
   6 |     1039 |    15061
   7 |     3072 |     8141
   8 |     2047 |     6684
   9 |      768 |     5143
  10 |     1280 |     3723
 ...
  #  | key_size |  count
-----+----------+----------
   1 |    16384 |       28
   2 |    16383 |        1
   3 |    15424 |        1
 ...
 189 |      512 |    37252
 190 |      511 |       32
 191 |      384 |        1
$ ls
ls           lsblk        lscpu        lslocks      lsof         lspgpot
lsattr       lsb_release  lsinitramfs  lsmod        lspci        lsusb
$ echo tmp/port_443/* | wc -c
2390056
$ cd tmp/port_443;echo * | wc -c
1755188
$ getconf ARG_MAX
2097152
$ sta/stats_parscan.sh -d -s -t tmp/port_443 sta/stats_parscan.sh: 81: sta/stats_parscan.sh: cat: Argument list too long cd tmp/port443 $ ../../sta/stats_parscan.sh -d -t . 2015-08-21 01:00:47 2015-08-22 12:41:18 49568 4292117295 5386322 1d 11:40:31 33419.6 41.9
“Make the Internet to a more secure place now!”
Dir                   Description
--- ----------------------------------------------------------
0.8 Main TCL modules for scanning and collecting - see A.1↓
bak Various project data backups, not basically project relevant
bin Used binary scanner programs - see A.2↓
cmd Command scripts for manual calls - see Section A.3↓
crt Directory for collected certificates (very large!) - see Section A.4↓
dat Data directory for input or some investigations - see Section A.7↓
etc Global configuration directory - see Section A.8↓
img Icons, Images, screen-shots, etc.
lib TCL packages, user libraries, etc. - see Section A.9↓
log Log files for evaluations, error analyzing - see Section A.5↓
mod Scan module plugins for scanner - see Section A.6↓
scr Shell scripts, utilities for scanning, etc. - see  A.10 on page 1↓
sql SQL install and structure dumps - see A.11 on page 1↓
sta Statistics and evaluation routines (for Thesis only) - see G on page 1↓
tmp Temporary scanner output (also used for monitoring purposes)
utl Utilities - “other” stuff, tools, aux tools, ... - see A.12 on page 1↓
web Web site scripts and HTML files (Web service) - see A.13 on page 1↓
0.8/db_sim2.tcl ........ FileDB management module (A.1.1↓)
0.8/manage_mpz.tcl ..... Multi precision MPZ module (A.1.2↓)
0.8/parse_pkcs1.tcl .... Script based limited parser (A.1.3↓)
0.8/retrieve_cert.tcl .. Retrieve certificate tool (A.1.4↓)
0.8/rsa_fromfile.tcl ... Get RSA info from certfile (A.1.5↓)
0.8/save_scan.tcl ...... Scan result postprocessor (A.1.6↓)
0.8/scan_sequ.tcl ...... Level I scanning module (A.1.7↓)
0.8/search_cert.tcl .... RSA key reverse lookup tool (A.1.8↓)
$ 0.8/db_sim2.tcl -h
FileDB management module  0.8
 -h .. display this help text
 -i .. show current sequence (start) and count information
 -d .. [start [count]] - read count ip-addr flag pairs from start
 -a .. [start [count]] - read count ip-addresses from start
 -v .. [start [count]] - read count flag values from start
 -o .. [start [count]] - direct output of ip addresses from start
 -l .. [start [count]] list - search for ip range from list
 -r .. range [start [count]] - search ips in range (format IP/mask)
 -u .. write start ip flag [..] - write ip flag pairs from start
 -w .. write start flag [..] - write flag values from start
 -f .. specify an alternate flatfile db - def. ipv4shuffle
 -s .. specify an alternate sequence db - def. ipv4shuffle
 -n .. insert record numbers before each data line
$ 0.8/manage_mpz.tcl -h
Multi precision MPZ modulus file management module 0.8
Usage: manage_mpz.tcl [-h] mode [-s start] [-n numrec] [-c condition] [-a] [-f filename]
  -h displays this help information
  The possible modes are:
    new .... a new file is created and the records are written to it
    add .... all found records data is appended to file
    read ... the requested data is read from MPZ file to display data
    uniq ... select unique keys and write MPZ file in mode ’new’
    write .. read binary data (.mpz) and write keys to text file (.dec)
    count .. read data and return only the number of values
    set .... do not read data, just set a new start value
  Option -c defines a specific database condition (SQL where clause)
  Option -s defines the start value for read records (def. 0)
  Option -n defines the number of records to return (def. 100000)
  Option -a for mode ’uniq’ the filemode is set to ’append’ (def. is ’new’)
  Option -f defines a specific input/output mpz-file
  If the number of records is < 1 all selected records are returned
  The ’set’ mode requires a numerical value with option -s
Script based limited certificate parser 0.8
Usage: parse_pkcs1.tcl [-k] [-c] pkcs1data ..
  -k .. following input is key data
  -c .. following input is a cert file
Default mode is -c
Retrieve certificate data from scan-list 0.8
 The adresses and ports are taken either from the global scanning
 table ’scan’ or from the already collected rsa table ’rsa_certs’
Usage: retrieve_cert.tcl [-h] [-s start] [-n numrec] [-e unused] [-r rsalist] [-d savedb] [-c writecrt] [-w async] [-t timeout] [-f filter] [-a addr] [-p port] [-i csvfile]
  -h displays this help information
  If -a is specified no value is read from the database, -p defaults to 443
  If a csv file is specified the address/port combination is read from the file
  If Option -e is 1 only ’empty’ values are selected (only new ones)
  If Option -d is set to 1 data is written to ’rsa_certs’, else nothing is saved
  If -t is set to 0 a sync tcp socket communication is used (no timeout)
  If -r is set to 0 the table ’scan’ is used as scanning list (sequence ’next_scanval’),
  if set to 1 the table ’rsa_certs’ is used as scanning list (sequence ’next_rsa_val’)
  With Option ’-c’ set to 1 the PEM certificate is stored locally as file
  Start value (-s) may be prefixed with + or - to calculate offsets to current value
  The -w requests sync tcp socket communication (no timeout)
  -f allows to specify a list filter (additional sql where clause to the select statement)
  Option -r 0 -e 1 corresponds to table scan with: status = ’’
  Option -r 0 -e 0 corresponds to table scan with: status <> ’blocked’
  Option -r 1 -e 1 corresponds to table rsa_certs with: key_type is null
  Option -r 1 -e 0 corresponds to table rsa_certs without any filter
  Defaults: start=17, numrec=100000, empty=0, savedb=1, timeout=1000, async=1, rsalist=0, writecrt=1, filter=
$ 0.8/rsa_fromfile.tcl -h
Retrieve or update RSA data 0.8
 from saved cert files using x509::pki TCL package
Usage: rsa_fromfile.tcl [-h] [-s start_id] [-n numrec] [-e unused] [-d savedb] [-a addr] [-p port] [-i certfile] [-f filter]
  -h displays this help information
  If -a is specified no value is read from the database, the file is retrieved from cert area
  Option -i defines the path to an existing PEM certificate file (disables savedb)
  Option -e selects the ’empty’ values, which don’t have a flag value
  Start value (-s) may be prefixed with + or - to calculate offsets
  -f allows to specify a list filter (additional sql where clause to the select statement)
  Defaults: start=0, numrec=100000, empty=1, savedb=0, addr=, port=443, filter=
$ 0.8/save_scan.tcl -h
Hispeed scan result postprocessor 0.8
Usage: save_scan.tcl [-h] [-s start] [-n numrec] job_name
  -h shows this usage information
  -s .. start offset (def. 0)
  -n .. number of records, 0 for all (def. 0)
 job_name is a scan output file without directory and extension
$ 0.8/scan_sequ.tcl -h
Sequential highspeed Level I scanning module for possible TLS services 0.8
Usage: scan_sequ.tcl [-h] [-d netdev] [-s start] [-p port] [-n numrec] [-m module]
  Defaults: netdev=, start=0, port=443,993, numrec=100000, module=masscan
$ 0.8/search_cert.tcl -h
Search service of broken keys 0.8
Usage: search_cert.tcl [-h] [-v] [-a addr -p port] [-f jsonfile] [-d delim] [-l lo] [-h hi] [key ..]
  -h displays this help information
  If -v is specified only valid from/to dates are retrieved
  If record delimiter -d is specified, a CSV output is created
  Options -a and -p retrieve specific stored certificate
  Option -f defines a json input file
  Otherwise all entries are interpreted as n-factors in decimal
  -l and -h define factor limits, -l means (p/q <= lo), -h means (p/q => hi) and (p/q > lo && p/q < hi)
$ bin/zmap64 -h
zmap 2.0.0-RC1
A fast Internet-wide scanner.
Usage: zmap [OPTIONS]... [SUBNETS]...
Basic arguments:
  -p, --target-port=port        port number to scan (for TCP and UDP scans)
  -o, --output-file=name        Output file
  -b, --blacklist-file=path     File of subnets to exclude, in CIDR notation,
                                  e.g. 192.168.0.0/16
  -w, --whitelist-file=path     File of subnets to constrain scan to, in CIDR
                                  notation, e.g. 192.168.0.0/16
Scan options:
  -r, --rate=pps                Set send rate in packets/sec
  -B, --bandwidth=bps           Set send rate in bits/second (supports suffixes
                                  G, M and K)
  -n, --max-targets=n           Cap number of targets to probe (as a number or
                                  a percentage of the address space)
  -t, --max-runtime=ses         Cap length of time for sending packets
  -N, --max-results=n           Cap number of results to return
  -P, --probes=n                Number of probes to send to each IP
                                  (default=‘1’)
  -c, --cooldown-time=secs      How long to continue receiving after sending
                                  last probe  (default=‘8’)
  -e, --seed=n                  Seed used to select address permutation
      --retries=n               Max number of times to try to send packet if
                                  send fails  (default=‘10’)
  -d, --dryrun                  Don’t actually send packets
      --shards=N                Set the total number of shards  (default=‘1’)
      --shard=n                 Set which shard this scan is (0 indexed)
                                  (default=‘0’)
Network options:
  -s, --source-port=port|range  Source port(s) for scan packets
  -S, --source-ip=ip|range      Source address(es) for scan packets
  -G, --gateway-mac=addr        Specify gateway MAC address
      --source-mac=addr         Source MAC address
  -i, --interface=name          Specify network interface to use
  -X, --vpn                     Sends IP packets instead of Ethernet (for VPNs)
Probe Modules:
  -M, --probe-module=name       Select probe module  (default=‘tcp_synscan’)
      --probe-args=args         Arguments to pass to probe module
      --list-probe-modules      List available probe modules
Data Output:
  -f, --output-fields=fields    Fields that should be output in result set
  -O, --output-module=name      Select output module  (default=‘default’)
      --output-args=args        Arguments to pass to output module
      --output-filter=filter    Specify a filter over the response fields to
                                  limit what responses get sent to the output
                                  module
      --list-output-modules     List available output modules
      --list-output-fields      List all fields that can be output by selected
                                  probe module
Logging and Metadata:
  -v, --verbosity=n             Level of log detail (0-5)  (default=‘3’)
  -l, --log-file=name           Write log entries to file
  -L, --log-directory=directory Write log entries to a timestamped file in this
                                  directory
  -m, --metadata-file=name      Output file for scan metadata (JSON)
  -u, --status-updates-file=name
                                Write scan progress updates to CSV file
  -q, --quiet                   Do not print status updates
  -g, --summary                 Print configuration and summary at end of scan
      --disable-syslog          Disables logging messages to syslog
      --notes=notes             Inject user-specified notes into scan metadata
      --user-metadata=json      Inject user-specified JSON metadata into scan
                                  metadata
Additional options:
  -C, --config=filename         Read a configuration file, which can specify
                                  any of these options
                                  (default=‘/etc/zmap/zmap.conf’)
  -T, --sender-threads=n        Threads used to send packets  (default=‘1’)
      --cores=STRING            Comma-separated list of cores to pin to
      --ignore-invalid-hosts    Ignore invalid hosts in whitelist/blacklist
                                  file
  -h, --help                    Print help and exit
  -V, --version                 Print version and exit
Examples:
    zmap -p 80 -o - (scan the Internet for hosts on port 80 and output to
stdout)
    zmap -N 5 -B 10M -p 80 -o -  (find 5 HTTP servers, scanning at 10 Mb/s)
    zmap -p 80 10.0.0.0/8 192.168.0.0/16 -o (scan 10./8, 192.168./16 on port 80)
    zmap -p 80 192.168.1.2 192.168.1.3 (scan 192.168.1.2, 192.168.1.3 on port 80)
Probe-module (tcp_synscan) Help:
Probe module that sends a TCP SYN packet to a specific port. Possible
classifications are: synack and rst. A SYN-ACK packet is considered a success
and a reset packet is considered a failed response.
Output-module (csv) Help:
no help text available
$ java -jar bin/ipscan-linux64-3.3.2.jar -h Unknown option: h Pass the following arguments: [options] <feeder> <exporter> Where <feeder> is one of: -f:range <Start IP> <End IP> -f:random <Base IP> <IP Mask> <Count> -f:file <File> <exporter> is one of: -o filename.txt Text file (txt) -o filename.csv Comma-separated file (csv) -o filename.xml XML file (xml) -o filename.lst IP:Port list (lst) And possible [options] are (grouping allowed): -s start scanning automatically -q quit after exporting the results -a append to the file, do not overwrite
$ bin/masscan64
usage:
masscan -p80,8000-8100 10.0.0.0/8 --rate=10000
 scan some web ports on 10.x.x.x at 10kpps
masscan --nmap
 list those options that are compatible with nmap
masscan -p80 10.0.0.0/8 --banners -oB <filename>
 save results of scan in binary format to <filename>
masscan --open --banners --readscan <filename> -oX <savefile>
 read binary scan results in <filename> and save them as xml in <savefile>

$ bin/masscan64 -h
usage:
masscan -p80,8000-8100 10.0.0.0/8 --rate=10000
 scan some web ports on 10.x.x.x at 10kpps
masscan --nmap
 list those options that are compatible with nmap
masscan -p80 10.0.0.0/8 --banners -oB <filename>
 save results of scan in binary format to <filename>
masscan --open --banners --readscan <filename> -oX <savefile>
 read binary scan results in <filename> and save them as xml in <savefile>
gerhard@nbl350:/net/pub/ASE/2015SS/MasterThesis/Software/keyservice$ bin/masscan64 --help
MASSCAN is a fast port scanner. The primary input parameters are the
IP addresses/ranges you want to scan, and the port numbers. An example
is the following, which scans the 10.x.x.x network for web servers:
 masscan 10.0.0.0/8 -p80
The program auto-detects network interface/adapter settings. If this
fails, you’ll have to set these manually. The following is an
example of all the parameters that are needed:
 --adapter-ip 192.168.10.123
 --adapter-mac 00-11-22-33-44-55
 --router-mac 66-55-44-33-22-11
Parameters can be set either via the command-line or config-file. The
names are the same for both. Thus, the above adapter settings would
appear as follows in a configuration file:
 adapter-ip = 192.168.10.123
 adapter-mac = 00-11-22-33-44-55
 router-mac = 66-55-44-33-22-11
All single-dash parameters have a spelled out double-dash equivalent,
so ’-p80’ is the same as ’--ports 80’ (or ’ports = 80’ in config file).
To use the config file, type:
 masscan -c <filename>
To generate a config-file from the current settings, use the --echo
option. This stops the program from actually running, and just echoes
the current configuration instead. This is a useful way to generate
your first config file, or see a list of parameters you didn’t know
about. I suggest you try it now:
 masscan -p1234 --echo

$ bin/masscan64 --nmap
Masscan (https://github.com/robertdavidgraham/masscan)
Usage: masscan [Options] -p{Target-Ports} {Target-IP-Ranges}
TARGET SPECIFICATION:
  Can pass only IPv4 address, CIDR networks, or ranges (non-nmap style)
  Ex: 10.0.0.0/8, 192.168.0.1, 10.0.0.1-10.0.0.254
  -iL <inputfilename>: Input from list of hosts/networks
  --exclude <host1[,host2][,host3],...>: Exclude hosts/networks
  --excludefile <exclude_file>: Exclude list from file
  --randomize-hosts: Randomize order of hosts (default)
HOST DISCOVERY:
  -Pn: Treat all hosts as online (default)
  -n: Never do DNS resolution (default)
SCAN TECHNIQUES:
  -sS: TCP SYN (always on, default)
SERVICE/VERSION DETECTION:
  --banners: get the banners of the listening service if available. The
    default timeout for waiting to recieve data is 30 seconds.
PORT SPECIFICATION AND SCAN ORDER:
  -p <port ranges>: Only scan specified ports
    Ex: -p22; -p1-65535; -p 111,137,80,139,8080
TIMING AND PERFORMANCE:
  --max-rate <number>: Send packets no faster than <number> per second
  --connection-timeout <number>: time in seconds a TCP connection will
    timeout while waiting for banner data from a port.
FIREWALL/IDS EVASION AND SPOOFING:
  -S/--source-ip <IP_Address>: Spoof source address
  -e <iface>: Use specified interface
  -g/--source-port <portnum>: Use given port number
  --ttl <val>: Set IP time-to-live field
  --spoof-mac <mac address/prefix/vendor name>: Spoof your MAC address
OUTPUT:
  --output-format <format>: Sets output to binary/list/unicornscan/json/grepable/xml
  --output-file <file>: Write scan results to file. If --output-format is
     not given default is xml
  -oL/-oJ/-oG/-oB/-oX/-oU <file>: Output scan in List/JSON/Grepable/Binary/XML/Unicornscan format,
     respectively, to the given filename. Shortcut for
     --output-format <format> --output-file <file>
  -v: Increase verbosity level (use -vv or more for greater effect)
  -d: Increase debugging level (use -dd or more for greater effect)
  --open: Only show open (or possibly open) ports
  --packet-trace: Show all packets sent and received
  --iflist: Print host interfaces and routes (for debugging)
  --append-output: Append to rather than clobber specified output files
  --resume <filename>: Resume an aborted scan
MISC:
  --send-eth: Send using raw ethernet frames (default)
  -V: Print version number
  -h: Print this help summary page.
EXAMPLES:
  masscan -v -sS 192.168.0.0/16 10.0.0.0/8 -p 80
  masscan 23.0.0.0/0 -p80 --banners -output-format binary --output-filename internet.scan
  masscan --open --banners --readscan internet.scan -oG internet_scan.grepable
SEE (https://github.com/robertdavidgraham/masscan) FOR MORE HELP
$ bin/ipshuffle64 -h
IP Address Shuffle program 0.5
  FH-Joanneum Keyservice Project
  (c) Gerhard Reithofer, Jun 24 2015, 21:10:26
Usage: bin/ipshuffle64 [-h] [-l] [-r] [-d level] [-i seed] [-s start] [-n numrecs] [-f outfile]
  numrecs .. num of ip recs in hex (def. 40000000)
  start .... start index in hex (def. 0)
  outfile .. output file name (def. ipv4shuffle.dat)
If numrecs is set to 0 the complete v4 range is used
If option ’-l’ (linear table) is used, shuffling is ommited
If option ’-r’ (reversed) is used, the ip byte range is reversed
The option ’-d’ defines the level of debugging output
The option ’-i’ allows the definition of specific srand seed value
$ cmd/collect_pubkeys.sh
Missing hostname or ssl port
Usage: collect_pubkeys.sh host port [pem]
$ cmd/extract_pubkey.sh
Missing cert file
Usage: extract_pubkey.sh pkcs1-file
$ cmd/masscan
Error: Missing input file name
Usage: masscan input_file output_file
crt/$1/$2/$3/$4/p$port.pem
crt/107/170/182/95/p993.pem    IMAPS (port 993) on IP address 107.170.182.95
crt/63/88/74/193/p443.pem      HTTPS on 63.88.74.193
crt/74/204/174/114/p22.pem     SSH on 74.204.174.114
etc/exclude.conf: excluding 32 ranges from file Starting masscan 1.0.3 (http://bit.ly/14GZzcT) at 2016-05-22 21:27:08 GMT -- forced options: -sS -Pn -n --randomize-hosts -v --send-eth Initiating SYN Stealth Scan Scanning 3970008572 hosts [19 ports/host]
Xipv4shuffle_20150517.dat
Xipv4shuffle_20150517.seq
ipv4rlinear_20150624.dat
ipv4rlinear_20150624.seq
uniq_20151120_1024d64.mpz
uniq_20151120_2048d64.mpz
uniq_20151120_2112hi.mpz
uniq_20151120_512low.mpz
uniq_20151120_all.mpz
# http://www.iana.org/assignments/iana-ipv4-special-registry/iana-ipv4-special-registry.xhtml # http://tools.ietf.org/html/rfc5735 # "This" network 0.0.0.0/8 # Private networks 10.0.0.0/8 # Carrier-grade NAT - RFC 6598 100.64.0.0/10 # Host loopback 127.0.0.0/8 # Link local 169.254.0.0/16 # Private networks 172.16.0.0/12 # IETF Protocol Assignments 192.0.0.0/24 # DS-Lite 192.0.0.0/29 # NAT64 192.0.0.170/32 # DNS64 192.0.0.171/32 # Documentation (TEST-NET-1) 192.0.2.0/24 # 6to4 Relay Anycast 192.88.99.0/24 # Private networks 192.168.0.0/16 # Benchmarking 198.18.0.0/15 # Documentation (TEST-NET-2) 198.51.100.0/24 # Documentation (TEST-NET-3) 203.0.113.0/24 # Reserved 240.0.0.0/4 # Limited Broadcast 255.255.255.255/32 #Received: from elbmasnwh002.us-ct-eb01.gdeb.com ([153.11.13.41] #Robert Mandes #Information Security Officer #General Dynamics #Electric Boat # #C 860-625-0605 #P 860-433-1553 153.11.0.0/16 #Received: from [165.160.9.58] (HELO mx2.cscinfo.com) #From: "Derksen, Bill" <bderksen@cscinfo.com> #Subject: Unauthorized Scanning #Corporation Service Company 165.160.0.0/16 # Your IP was observed making connections to TCP/IP IP address 149.93.26.231 # (a conficker sinkhole) with a destination port 80, source port (for this detection) 149.93.26.231 # Von: infosec-noreply@caltech.edu [mailto:infosec-noreply@caltech.edu] # Gesendet: Donnerstag, 25. Dezember 2014 22:46 # An: abuse@a1telekom.at # Hetzner-Support 88.198.0.0/16 136.243.0.0/16 138.201.0.0/16 148.251.0.0/16 185.12.64.0/22 213.133.96.0/19 213.239.192.0/18 # Abuse Message 1C4CAC21.txt # # ########################################################################## # # Netscan detected from host 94.101.38.222 # # ########################################################################## 78.46.0.0/15 # Subject: [NicBr-20150629-137] TCP PORT SCAN 94.101.38.222 -> xxx.xxx.2.0/23 # Date: Mon, 29 Jun 2015 05:27:47 -0300 (BRT) # From: abuse@registro.br # Igor Rigonato 200.160.0.0/20 # Das klärt einiges auf. Ich würde mich sehr # freuen, wenn Sie unsere Adressbereiche 134.94.0.0/16 und 194.95.187.0/24 von # den Scans ausnehmen. # Egon Grünter, FZJ-CERT 134.94.0.0/16 194.95.187.0/24 # alfahostig # "2015-07-08 00:12:28" 94.101.38.222/51763->xxx.xxx.5.34/993 6(0) 94.101.38.0 - 94.101.39.255 # Betreff: [noreply] abuse report about 185.3.232.72 - Mon, 23 May 2016 02:13:35 +0200 # — service: portflood (First x 1) RID: 743769679 # Datum: Mon, 23 May 2016 02:13:44 +0200 (CEST) # Von: Abuse-Team (auto-generated) # # Email an support@blocklist.de mit Erklärung der Situation. # Die IP-Adresse 5.196.200.157 wird aus weiteren Scans Scan ausgenommen. 5.196.200.157 # Subject: 185.3.232.72 blocked at caltech.edu # Date: Sun, 22 May 2016 18:02:14 -0700 # From: infosec-noreply@caltech.edu # Die IP-Adresse 66.148.70.33 wird aus weiteren Scans Scan ausgenommen. # Der Adressbereich wurde auf 66.148.64.0/18 ausgeweitet 66.148.70.0/18 # Subject: Network abuse from 185.3.232.72 # Date: Mon, 23 May 2016 23:27:09 +0000 # From: Rodney Campbell <Rodney.Campbell@citec.com.au> 203.9.184.0 - 203.9.187.255 131.242.0.0 - 131.242.255.255 # Subject: 185.3.232.72: possible malicious activity from this host # Subject: [USU Attack Report #31564] Malicious / Suspicious Activity - IP/CIDR Address: 185.3.232.72 # Date: Mon, 23 May 2016 16:15:17 -0600 # From: Miles Johnson via RT <security@usu.edu> 129.123.0.0/16 144.39.0.0/16 204.113.91.0/24 # Subject: Hacking Activity from 185.3.232.72 # Date: Tue, 24 May 2016 11:49:17 -0300 (BRT) # From: mtso@matera.com 201.16.192/18 # Hi Gerhard, # Thanks for the detail response. I’ll add 185.3.232.72 to our whitelist. # # Regards, # — # Juan Gallego (abuse@physics.mcgill.ca) Department of Physics ### 143.106.0.0/16 # Subject: Loginattempts from Your net # Date: Wed, 25 May 2016 12:12:44 +0200 (CEST) # From: elwood@agouros.de 194.77.40.240/29
rate = 1000000000
excludefile = etc/exclude.conf
randomize-hosts = false
banner = true
# ports = 22,443
ports = 22,443,465,563,636,989,990,991,992,993,994,995,2083,2087,2096,4031,8140,8443,9050
output-status = open
randomize-hosts = false
#
# FileDB configuration file
#
###################################################
# flat file database
FILE_DB DATA_DIR ./dat
FILE_DB DATABASE ipv4shuffle_20150624
###################################################
#
# MPZ export file
FILE_DB EXPORT KEYFILE ./dat/export.mpz
##################################################
#
#  Database spectific settings for saving
#
###
# database server
# SCANNER DATABASE SERVER nserver
SCANNER DATABASE SERVER localhost
# database name
SCANNER DATABASE DBASE keyservice
# SCANNER DATABASE DBASE newservice
# database username
SCANNER DATABASE USERNAME keymaster
# database username
SCANNER DATABASE PASSWORD secr-pa$$w0rd
###################################################
#
#  ports to check for SSL service
#
# grep SS /etc/services | \
#   sed ’s:/tcp::’|awk ’{print $2,$1}’|sort -n| \
#   awk ’{printf(" %s %s", $1, $2)}END{print ""}’
#
# REMOTE SSL_PORTS { ssh 22 https 443 ssmtp 465 nntps 563 ldaps 636
#   ftps-data 989 telnets 992 imaps 993 ircs 994 pop3s 995 suucp 4031}
# }
# 22,443,465,563,636,989,992,993,994,995,4031
#
# proto-banner1.c
# 443;   /* HTTP/s */
# 465;   /* SMTP/s */
# 990;   /* FTP/s */
# 991;
# 992;   /* Telnet/s */
# 993;   /* IMAP4/s */
# 994;
# 995;   /* POP3/s */
# 2083;  /* cPanel - SSL */
# 2087;  /* WHM - SSL */
# 2096;  /* cPanel webmail - SSL */
# 8140;  /* puppet */
# 8443;  /* Plesk Control Panel - SSL */
# 9050;  /* Tor */
# REMOTE SSL_PORTS { ssh 22 https 443 ssmtp 465 nntps 563 ldaps 636
#   ftps-data 989 unkn1 991 telnets 992 imaps 993 ircs 994 pop3s 995
#   cPanel 2083 WHM 2086 suucp 4031 puppet 8140 Plesk 8443 9050 Tor}
# }
#
# 22,443,465,563,636,989,990,991,992,993,994,995,2083,2087,2096,4031,8140,8443,9050
#
# max. 7 entries, flag 0xffff is reserved for "ignored"
#
SCANNER SSL_PORTS {
  https     443
  ssmtp     465
  nntps     563
  ldaps     636
  ftps-data 989
  telnets   992
  imaps     993
  ircs      994
  pop3s    4031
  cPanel   2083
  WHM      2086
  suucp    4031
  puppet   8140
  Plesk    8443
  ssh        22
}
#
# 22,443,465,636,993,994,4031
#
###################################################
#
SCANNER SCAN_MODULE masscan
# SCANNER NET_DEVICE eth0
# SCANNER PORT_NUMBER 443
# SCANNER PORT_NUMBER 22,4031,465,636,989,994,8443,993,8140,993
SCANNER PORT_NUMBER 22,443,993
# max. scanning level ...
SCANNER MAX_LEVEL 6
# default number of records to scan or export
SCANNER NUM_RECS 100000
# max. allowed timeout for TLS connection in millis
# SCANNER SOCKET_TIMEOUT 2000
SCANNER SOCKET_TIMEOUT 1000
lib/aes             AES encryption routines(tcllib)
lib/asn             ASN1 parsing library(tcllib)
lib/base64          Base64 en/decoding (tcllib)
lib/csv             CSV module (tcllib, for statistics)
lib/des             DES en/decryption module (tcllib)
lib/dns             DNS library (tcllib)
lib/emu             Graphical chart library (unused?)
lib/fsdialog        “Beauty” portable file selector in TCL
lib/json            JSON library (tcllib)
lib/l-c             TCL-TLS source code and binary
lib/math            Math modules (tcllib, for statistics)
lib/md5             MD5 module (tcllib)
lib/pki             PKI module (tcllib, incomplete)
lib/sha1            SHA1 library (tcllib)
lib/pgintcl-3.5.0/
lib/Plotchart2.3.5/
AppUtil.tcl   Application config handling and debug-tools
basetools.tcl Common used functions like FileIO, conversions, etc.
file_db.tcl   File database module - Linear Address Table functions
get_cert.tcl  Retrieve certificate module
pg_intf.tcl   Database interface functions - usable with Pgtcl and pgintcl
pkgIndex.tcl  Package loader file
scan_db.tcl   Scanning database interface
whois.tcl     Whois implementation (experimental)
$  scr/manage_jobs.sh -h
Usage: manage_jobs.sh [-h] [-x] [job_name [..]]
 -h .. show this help
 -l .. return all open jobs as single list
 -x .. reexecute all open missing jobs
 Given jobs will be reexecuted again
$ scr/monitor_procs.sh
Missing task name to monitor
Usage: monitor_procs.sh taskname [sleeptime]
  Current sleeptime is 10
$ scr/log_dbinserts.sh
Usage: log_dbinserts.sh [seq|rsa|upd] [waittime]
  seq: table scan, sequence scan
  rsa: table rsa_certs, sequence scan
  upd: table rsa_certs, sequence rsa
  Database: keyservice
  Waittime: 60 seconds
$ scr/monitored_seq.sh
Usage: monitored_seq.sh [start|stop]
$ scr/monitored_rsa.sh
Usage: monitored_rsa.sh [start|stop|status]
#!/bin/bash
#
# Starting of
# 1. par_scan_rsa.sh (retrieve_cert)
# 2. monitor_procs.sh (retrieve_cert)
# 3. log_dbinserts.sh (retrieve_cert)
#
out()
{ # $* text output
echo "$(date +%Y-%m-%d/%H:%M:%S): $*"
}
WAITTIME=60
TIMESTMP=$(date +%Y-%m-%d)
CURR_DIR=$(dirname $0)
cd $CURR_DIR/..
BASE_DIR=$PWD
RLOG_PRE=$BASE_DIR/log/retrieve_cert_$TIMESTMP
SLOG_PRE=$BASE_DIR/log/retrieve_stop_$TIMESTMP
REXECUTE=retrieve_cert.tcl
cd $BASE_DIR/scr/dir_rsa
case "$1" in
start )
nohup $BASE_DIR/scr/par_scan_rsa.sh 1>>$RLOG_PRE.slog 2>>$RLOG_PRE.elog &
nohup $BASE_DIR/scr/monitor_procs.sh $REXECUTE $WAITTIME &
nohup $BASE_DIR/scr/log_dbinserts.sh rsa $WAITTIME &
;;
stop )
for PNAME in par_scan_rsa.sh monitor_procs.sh log_dbinserts.sh
do PROC_ID=$(ps -ef|grep $PNAME|grep -vw grep|awk ’{print $2}’)
if [ ! -z "$PROC_ID" ]
then out "Killing $PROC_ID($PNAME) ..."
kill $PROC_ID
else out "Process $PNAME not running."
fi
done
NUM_PROCS=$(ps -ef|grep $REXECUTE|grep -vw grep|wc -l)
START=$(date +%s)
while [ $NUM_PROCS -gt 0 ]
do out "$NUM_PROCS $REXECUTE processes still running ..."
sleep 5
NUM_PROCS=$(ps -ef|grep $REXECUTE|grep -vw grep|wc -l)
done
ENDP=$(date +%s)
DIFF=$(expr $ENDP - $START)
out "all $REXECUTE processes finished after $DIFF seconds."
;;
status )
for PNAME in par_scan_rsa.sh monitor_procs.sh log_dbinserts.sh
do PROC_ID=$(ps -ef|grep $PNAME|grep -vw grep|awk ’{print $2}’)
if [ ! -z "$PROC_ID" ]
then out "Running $PROC_ID($PNAME) ..."
else out "Process $PNAME not running."
fi
done
NUM_PROCS=$(ps -ef|grep $REXECUTE|grep -vw grep|wc -l)
out "$NUM_PROCS $REXECUTE processes running ..."|tee -a $SLOG_PRE.log
;;
* )
echo "Usage: $(basename $0) [start|stop|status]"
;;
esac
#!/bin/sh
#
BASE_DIR=$(dirname $0)/..
LOGF_DIR=$BASE_DIR/log
CFG_FILE=$BASE_DIR/etc/masscan.cfg
LOG_FILE=$LOGF_DIR/basescan_all.log
ERR_FILE=$LOGF_DIR/basescan_all.err
OUT_FILE=$BASE_DIR/tmp/basescan_all.out
IP_RANGE="0.0.0.0/0"
echo $BASE_DIR/cmd/masscan -c $CFG_FILE -oL $OUT_FILE $IP_RANGE
$BASE_DIR/cmd/masscan -c $CFG_FILE -oL $OUT_FILE $IP_RANGE 1>$LOG_FILE 2>$ERR_FILE &
select count(*) from $TABLE;
keyservice_inst.sql SQL dazabse install script (B.1.4↓)
keyservice-schema.sql  Complete keyservice schema export
rsa_certs-schema.sql   Schema export for table rsa_certs
scan-schema.sql        Schema export for table scan
backup.sh          - backup script -> bak
calc_speed.tcl     - calc sanning rate from masscan output files (G.1.2↓)
dist_calc.sh       - calculate “IP distance” from hetzner IP list
dist_check.tcl     - check “IP distance” from “Randomized Linear Address Table”
dist_create.tcl    - extract “hetzner” IP list from file_db
dist_hetzner.sh    - calculate “IP distance” from hetzner log files
distinct.sh        - extract top ten hashes from all_hashes.txt file
export_all.sh      - export all uniq certs (<512,1024+/-512,2048+/-512,>2560,all)
f_sequential.tcl   - file list serializer, joins listed files in dictionary order
join_crt_lists.sh  - cert file joiner, crt+old+err
join_rsa.tcl       - join rsa_certs from DB new+old (A.12.1↓)
mark_blocked.sh    - create SQL statement for blocking “scan” records (A.12.2↓)
rsa_convert.sh     - convert certificate file from/to (der|net|pem) using “openssl”
rsa_data_errors.sh - CSV extrcat RSA “data_insert” errors from scan
rsa_extract.sh     - extract RSA infos from certificate file
split_bigfile.sh   - script to split basescan_all.out to part files
select2CSV.sh      - SQL select into CSV file (A.12.3↓)
dnsync.sh          - rsync from server to local WS
upsync.sh          - rsync from local WS to server (A.12.4↓)
dsc.sh             - single file down copy using scp (A.12.6↓)
usc.sh             - single file up copy using scp (A.12.5↓)
sc                 - show certificate - display saved certificate or file path
$ utl/join_rsa.tcl -h
Scan table join utility 0.1
Usage: utl/join_rsa.tcl [-h] [-s start] [-n count]
 -h .. this help text
 -s .. set start value (rsa_certs id) for next block (22577893)
 -n .. set number of rsa_cert records for joining (100000)
$ utl/select2CSV.sh -h
Usage: select2CSV.sh [-h] [-d database] [-s sep] [-o oufile] query ..
 -h .. this help text
 -d .. name of database, (def. keyservice)
 -s .. specifies the record separator for CSV-file (def. ’;’)
 -o .. name of the output CSV-file, (def. stdout)
$ utl/upsync.sh
Missing sync destination, valid: LowCost MemPower FHCluster
$ utl/usc.sh
Usage: usc.sh from(local) to(remote)
  copies local file to remote directory
  remote host: d10122.dedicated.alfahosting-pro.de
  remote user: keymaster
  remote base: keyservice/
$ utl/dsc.sh
Usage: dsc.sh from(remote) to(local)
  copies remote file to local directory
  remote host: d10122.dedicated.alfahosting-pro.de
  remote user: keymaster
  remote base: keyservice/
main.css      - CSS stylesheet
index.html    - Project information and keyservice page
checkkey.php  - Script for checking a single public RSA key
download.php  - Script for downloading the results as ASCII file
include.php   - Common used functions and tools
                List of relations
 Schema |       Name        |   Type   |   Owner
--------+-------------------+----------+-----------
 public | parameters        | table    | keymaster
 public | parameters_id_seq | sequence | keymaster
 public | rsa_certs         | table    | keymaster
 public | rsa_certs_id_seq  | sequence | keymaster
 public | scan              | table    | keymaster
 public | scan_id_seq       | sequence | keymaster
 public | seq_table         | table    | keymaster
Table "public.scan"
     Column     |            Type             |           Modifiers
----------------+-----------------------------+----------------------------------
 id             | bigint                      | not null default nextval(’scan_id_seq’::regclass)
 ip_address     | inet                        | not null
 service        | integer                     | not null
 level          | integer                     | default 1
 certificate_id | bigint                      |
 keyinfo        | character varying           |
 keydata        | bytea                       |
 seen_at        | timestamp without time zone | not null default now()
 flag           | character varying           |
 status         | character varying           | not null default ’’::character varying
Indexes:
    "scan_pkey" PRIMARY KEY, btree (id)
    "u_a_s_s" UNIQUE CONSTRAINT, btree (ip_address, service)
    "scan_ip_address_service_idx" btree (ip_address, service)
                                        Table "public.rsa_certs"
      Column      |            Type             |           Modifiers
------------------+-----------------------------+----------------------------------------
 id               | bigint                      | not null default nextval(’rsa_certs_id_seq’::regclass)
 last_mod         | timestamp without time zone | not null default now()
 ip_address       | inet                        | not null
 service          | integer                     | not null
 level            | integer                     | not null default 1
 status           | character varying           |
 sha1_hash        | character varying           | not null
 serial_number    | character varying           | not null
 version          | integer                     |
 subject          | character varying           | not null
 issuer           | character varying           | not null
 rsa_e            | bigint                      |
 rsa_n            | bytea                       |
 rsa_d            | bigint                      |
 rsa_p            | bytea                       |
 rsa_q            | bytea                       |
 sbits            | integer                     | not null
 not_valid_before | timestamp without time zone | not null
 not_valid_after  | timestamp without time zone | not null
 cipher           | character varying           | not null
 chain            | character varying           |
 key_type         | character varying           |
 key_size         | smallint                    |
Indexes:
    "rsa_certs_pkey" PRIMARY KEY, btree (id)
    "u_a_s_r" UNIQUE CONSTRAINT, btree (ip_address, service, sha1_hash)
    "rsa_certs_ip_address_service_idx" btree (ip_address, service)
    "rsa_certs_sha1_hash_idx" btree (sha1_hash)
    "rsa_n_md5_index" btree (md5(rsa_n))
            Table "public.seq_table"
 Column |       Type        |     Modifiers
--------+-------------------+--------------------
 name   | character varying | not null
 value  | bigint            | not null default 0
Indexes:
    "seq_table_name_key" UNIQUE CONSTRAINT, btree (name)
     name     |  value
--------------+----------
 next_scanval |       17
 next_export  |        0
 next_rsa_val |    40003
 next_joinval | 22577892
CREATE TABLE scan  (
    id             bigserial NOT NULL  PRIMARY KEY,
    ip_address     inet      NOT NULL,
    service        integer   NOT NULL,
    level          integer   DEFAULT   1,             /* scanning level */
    certificate_id bigint    NULL,                    /* only the last ... */
    keyinfo        varchar   NULL,                    /* SSL/TLS banner */
    keydata        bytea     NULL,                    /* cert from scan level 1 job */
    seen_at        timestamp NOT NULL  DEFAULT now(),
    flag           varchar   NULL,                    /* banner type (ssl, X509, ...) */
    status         varchar   NOT NULL  DEFAULT ’’     /* handshake result */
);
alter table scan add constraint "u_a_s_s" unique(ip_address, service);
create index on scan (ip_address, service);
create index on scan (ip_address, service, status);

CREATE TABLE rsa_certs  (
    id               bigserial  NOT NULL	PRIMARY KEY,
    last_mod         timestamp  NOT NULL	DEFAULT now(),
    ip_address       inet       NOT NULL,
    service          integer	NOT NULL,
    level            integer	NOT NULL	DEFAULT 1
    status           varchar,
    sha1_hash        varchar	NOT NULL,
    serial_number    varchar	NOT NULL,
    version          integer,
    subject          varchar	NOT NULL,
    issuer           varchar	NOT NULL,
    rsa_e            bigint,  /* in RSA it is bignum */
    rsa_n            bytea,
    rsa_d            bigint,  /* in RSA it is bignum */
    rsa_             bytea,
    rsa_q            bytea,
    sbits            integer	NOT NULL,
    not_valid_before timestamp  NOT NULL,
    not_valid_after  timestamp  NOT NULL,
    cipher           varchar    NOT NULL,
    chain            varchar,
    key_type         varchar,
    key_size         smallint
);
create index on rsa_certs (ip_address, service);
alter table rsa_certs add constraint "u_a_s_r" unique(ip_address, service, sha1_hash);
-- special index on rsa_n due the following limitation.
-- keyservice=# create index on rsa_certs(rsa_n);
-- ERROR:  index row size 4112 exceeds maximum 2712 for index "rsa_certs_rsa_n_idx"
-- TIP:  Values larger than 1/3 of a buffer page cannot be indexed.
-- Consider a function index of an MD5 hash of the value, or use full text indexing.
create index rsa_n_md5_index on rsa_certs(md5(rsa_n));

create table seq_table (
    name     varchar  NOT NULL UNIQUE,
    value    bigint   NOT NULL DEFAULT 0
);
insert into seq_table values (’next_scanval’, 0);
insert into seq_table values (’next_rsa_val’, 0);
insert into seq_table values (’next_export’ , 0);
insert into seq_table values (’next_joinval’, 0);
| Name | Port | Protocol | Destination | Last Scan |
| 0-icmp-echo_request-full_ipv4 | icmp | full ipv4 | 2016-09-16 23:13:09 | |
| 21-ftp-banner-full_ipv4 | 21 | ftp | full ipv4 | 2016-09-19 22:27:06 |
| 22-ssh-banner-full_ipv4 | 22 | ssh | full ipv4 | 2016-09-14 18:41:32 |
| 23-telnet-banner-full_ipv4 | 23 | telnet | full ipv4 | 2016-09-20 23:56:34 |
| 25-smtp-dhe_export-1%_sample_ipv4 | 25 | smtp | 1% sample ipv4 | 2016-09-20 14:14:51 |
| 25-smtp-starttls-alexa_top1mil | 25 | smtp | alexa top1mil | 2016-09-20 12:31:25 |
| 53-dns-lookup-full_ipv4 | 53 | dns | full ipv4 | 2016-09-18 23:21:49 |
| 80-http-get-alexa_top1mil | 80 | http | alexa top1mil | 2016-09-20 12:44:22 |
| 80-http-get-full_ipv4 | 80 | http | full ipv4 | 2016-09-05 23:35:02 |
| 102-s7-szl-full_ipv4 | 102 | s7 | full ipv4 | 2016-09-14 12:30:42 |
| 110-pop3-starttls-full_ipv4 | 110 | pop3 | full ipv4 | 2016-09-18 00:09:00 |
| 143-imap-starttls-full_ipv4 | 143 | imap | full ipv4 | 2016-09-18 22:45:29 |
| 443-https-dhe-alexa_top1mil | 443 | https | alexa top1mil | 2016-09-20 12:56:57 |
| 443-https-dhe-full_ipv4 | 443 | https | full ipv4 | 2016-09-18 23:11:43 |
| 443-https-dhe_export-1%_sample_ipv4 | 443 | https | 1% sample ipv4 | 2016-09-21 04:14:52 |
| 443-https-dhe_export-alexa_top1mil | 443 | https | alexa top1mil | 2016-09-20 11:38:20 |
| 443-https-dhe_export-full_ipv4 | 443 | https | full ipv4 | 2016-09-15 22:32:34 |
| 443-https-heartbleed-alexa_top1mil | 443 | https | alexa top1mil | 2016-09-20 14:23:53 |
| 443-https-heartbleed-full_ipv4 | 443 | https | full ipv4 | 2016-09-21 00:35:30 |
| 443-https-rsa_export-1%_sample_ipv4 | 443 | https | 1% sample ipv4 | 2016-09-21 04:29:50 |
| 443-https-rsa_export-alexa_top1mil | 443 | https | alexa top1mil | 2016-09-20 14:25:37 |
| 443-https-rsa_export-full_ipv4 | 443 | https | full ipv4 | 2016-09-15 22:39:13 |
| 443-https-ssl_3-alexa_top1mil | 443 | https | alexa top1mil | 2016-09-20 15:27:50 |
| 443-https-ssl_3-full_ipv4 | 443 | https | full ipv4 | 2016-09-14 23:00:00 |
| 443-https-tls-alexa_top1mil | 443 | https | alexa top1mil | 2016-09-20 10:49:15 |
| 443-https-tls-full_ipv4 | 443 | https | full ipv4 | 2016-09-20 09:36:29 |
| 465-smtps-tls-full_ipv4 | 465 | smtps | full ipv4 | 2016-09-20 22:32:47 |
| 502-modbus-device_id-full_ipv4 | 502 | modbus | full ipv4 | 2016-09-18 07:56:09 |
| 993-imaps-dhe_export-full_ipv4 | 993 | imaps | full ipv4 | 2016-09-21 04:14:50 |
| 993-imaps-tls-full_ipv4 | 993 | imaps | full ipv4 | 2016-09-15 00:09:21 |
| 995-pop3s-tls-full_ipv4 | 995 | pop3s | full ipv4 | 2016-09-17 00:10:25 |
| 1911-fox-device_id-full_ipv4 | 1911 | fox | full ipv4 | 2016-09-19 11:58:34 |
| 7547-cwmp-get-full_ipv4 | 7547 | cwmp | full ipv4 | 2016-09-14 22:41:17 |
| 20000-dnp3-status-full_ipv4 | 20000 | dnp3 | full ipv4 | 2016-09-17 12:28:20 |
| 47808-bacnet-device_id-full_ipv4 | 47808 | bacnet | full ipv4 | 2016-09-16 11:58:32 |
| Port | Open ports | Found certs | Certs % | Expected service |
| 22 | 15753958 | 0 | 00.00 | SSH |
| 443 | 38529358 | 19714543 | 51.17 | HTTP/s |
| 465 | 5223677 | 2042323 | 39.10 | SMTP/s |
| 563 | 2170734 | 29891 | 01.38 | NNTP/s |
| 636 | 2255812 | 64122 | 02.84 | LDAP/s |
| 989 | 2033068 | 902 | 00.04 | FTP/s-data |
| 990 | 1993651 | 138522 | 06.95 | FTP/s |
| 991 | 1609847 | 832 | 00.05 | |
| 992 | 1607972 | 18218 | 01.13 | Telnet/s |
| 993 | 3656833 | 1615414 | 44.18 | IMAP4/s |
| 994 | 1320289 | 990 | 00.07 | IRC/s |
| 995 | 3327227 | 1443294 | 43.38 | POP3/s |
| 2083 | 2625086 | 610982 | 23.27 | cPanel - SSL |
| 2087 | 2687838 | 579922 | 21.58 | WHM - SSL |
| 2096 | 3055931 | 712072 | 23.30 | cPanel webmail - SSL |
| 4031 | 1644898 | 767 | 00.05 | s/UUCP |
| 8140 | 1776439 | 13173 | 00.74 | Puppet |
| 8443 | 3669432 | 764775 | 20.84 | Plesk Control Panel - SSL |
| 9050 | 2126644 | 11767 | 00.55 | Tor |
| All | 97068694 | 27762509 | 28.60 | Summary values |
[2048_104135]: scan job start: 2015-05-22/10:35:24
[2048_106183]: scan job start: 2015-05-22/10:35:25
[2048_108231]: scan job start: 2015-05-22/10:35:26
[2048_110279]: scan job start: 2015-05-22/10:35:27
[2048_104135]: scan job finished: 2015-05-22/10:36:14
[2048_104135]: approx. traffic: 3572964 bytes
[2048_104135]: 2048 IPs scanned in 00:00:50 (41.0/sec), 33 SSL related IPs (1.61%) found (0.66/sec)
[2048_106183]: scan job finished: 2015-05-22/10:36:18
[2048_106183]: approx. traffic: 3730304 bytes
[2048_106183]: 2048 IPs scanned in 00:00:53 (38.6/sec), 32 SSL related IPs (1.56%) found (0.60/sec)
[2048_110279]: scan job finished: 2015-05-22/10:36:20
[2048_110279]: approx. traffic: 3547280 bytes
[2048_110279]: 2048 IPs scanned in 00:00:53 (38.6/sec), 29 SSL related IPs (1.42%) found (0.55/sec)
[2048_108231]: scan job finished: 2015-05-22/10:36:24
[2048_108231]: approx. traffic: 3785842 bytes
[2048_108231]: 2048 IPs scanned in 00:00:58 (35.3/sec), 32 SSL related IPs (1.56%) found (0.55/sec)
  count  |    to_char
---------+---------------
    6278 | 2015-08-21 00
 1080597 | 2015-08-21 01
  640336 | 2015-08-21 02
  182215 | 2015-08-21 10
  187726 | 2015-08-21 11
  200920 | 2015-08-21 12
  203778 | 2015-08-21 13
  204006 | 2015-08-21 14
  203868 | 2015-08-21 15
  133785 | 2015-08-21 16
   72331 | 2015-08-21 17
   70711 | 2015-08-21 18
   71464 | 2015-08-21 19
  170708 | 2015-08-21 20
  210001 | 2015-08-21 21
  208458 | 2015-08-21 22
  208484 | 2015-08-21 23
  211611 | 2015-08-22 00
  208490 | 2015-08-22 01
  134451 | 2015-08-22 02
   72955 | 2015-08-22 03
   75916 | 2015-08-22 04
   76730 | 2015-08-22 05
   75063 | 2015-08-22 06
   74068 | 2015-08-22 07
   76668 | 2015-08-22 08
   75299 | 2015-08-22 09
   60953 | 2015-08-22 10
  341297 | 2015-08-22 13
  498221 | 2015-08-22 14
  470607 | 2015-08-22 15
  410152 | 2015-08-22 16
  464801 | 2015-08-22 17
  459344 | 2015-08-22 18
  416040 | 2015-08-22 19
  362745 | 2015-08-22 20
Start: 2015-08-22_22:28:10 scan_20150822_10000_7306
Module masscan successfully loaded
Scan started: 0753800000_100000 2015-08-22/22:28:10
Pre-Action: 100000 records written to input file /home/keymaster/keyservice/tmp/0753800000_100000.txt
etc/exclude.conf: excluding 32 ranges from file
Starting masscan 1.0.3 (http://bit.ly/14GZzcT) at 2015-08-22 20:28:46 GMT
 — forced options: -sS -Pn -n --randomize-hosts -v --send-eth
Initiating SYN Stealth Scan
Scanning 92251 hosts [9 ports/host]
rate: 15.63-kpps,  9.62% done,   0:00:56 remaining, found=58
rate: 15.07-kpps, 22.54% done,   0:00:40 remaining, found=180
rate: 36.99-kpps, 32.50% done,   0:00:40 remaining, found=271
rate: 19.88-kpps, 43.41% done,   0:00:32 remaining, found=357
rate: 16.46-kpps, 58.88% done,   0:00:17 remaining, found=467
rate: 31.95-kpps, 71.48% done,   0:00:13 remaining, found=592
rate: 15.34-kpps, 85.09% done,   0:00:07 remaining, found=745
rate: 12.98-kpps, 95.62% done,   0:00:02 remaining, found=842
rate:  0.02-kpps, 100.00% done, waiting 10-secs, found=897
rate:  0.02-kpps, 100.00% done, waiting 9-secs, found=897
rate:  0.00-kpps, 100.00% done, waiting 8-secs, found=897
rate:  0.07-kpps, 100.00% done, waiting 7-secs, found=898
rate:  0.00-kpps, 100.00% done, waiting 6-secs, found=898
rate:  0.02-kpps, 100.00% done, waiting 5-secs, found=898
rate:  0.02-kpps, 100.00% done, waiting 4-secs, found=898
rate:  0.02-kpps, 100.00% done, waiting 3-secs, found=898
rate:  0.03-kpps, 100.00% done, waiting 2-secs, found=899
rate:  0.02-kpps, 100.00% done, waiting 1-secs, found=899
rate:  0.00-kpps, 100.00% done, waiting 0-secs, found=899

Exec-Scan finished, 1 results written to /home/keymaster/keyservice/tmp/0753800000_100000.csv
Post-Action: 911 results found
[0753800000_100000]: 100000 IPs scanned in 00:01:42 (980.4/sec), 911 SSL related IPs (0.91% - 8.93/sec), unknown=1
    ssl=4 ssh=4 open=899 db_update=2 db_insert=777 complete=911 X509=3
Scan finished: 0753800000_100000 2015-08-22/22:29:52
Name: tmp/0753800000_100000.txt filesize: 1424840 (1.36M) modified: 2015-08-22 22:28:12 Name: tmp/0753800000_100000.csv filesize: 36868 (36.0K) modified: 2015-08-22 22:29:51 Name: log/scan_20150822_10000__1_7306.log filesize: 12329 (12.0K) modified: 2015-08-22 22:29:52
| Feature | Value |
| CPU: | AMD Opteron 6212, 2 x 8 Core (2,6 GHz) |
| Harddisk: | 2 x 2000 GB |
| RAM: | 48 GB |
| Traffic: | Unlimited |
| NIC: | 1000 Mbit/s |
| Bandwidth | 100 Mbit/s (500 MBit/s in phase 2) |
| FTP-Backup: | 1000 GB |
| SSH Access: | Yes |
| IPv4-Address: | 1 |
| Availabilty: | 99,9 % |
$openssl s_client -connect $HOST:$PORT </dev/null 2>/dev/null|openssl x509 -noout -text
Certificate:
    Data:
        Version: 3 (0x2)
        Serial Number:
            35:ce:c0:a2:e8:7c:b6:15:f3:b4:04:41:ae:61:88:09
    Signature Algorithm: sha256WithRSAEncryption
        Issuer: C=NL, ST=Noord-Holland, L=Amsterdam, O=TERENA, CN=TERENA SSL CA 2
        Validity
            Not Before: Apr 24 00:00:00 2015 GMT
            Not After : May 21 23:59:59 2018 GMT
        Subject: OU=Domain Control Validated, CN=www.fh-joanneum.at
        Subject Public Key Info:
            Public Key Algorithm: rsaEncryption
                Public-Key: (2048 bit)
                Modulus:
                    00:a8:61:77:f4:c3:6a:32:49:93:48:2a:95:30:b9:
                    bc:4c:39:db:26:75:48:e3:ac:c3:7e:b6:a1:6b:29:
                    d6:8c:76:82:b9:3e:21:5a:70:10:e6:84:da:85:f3:
                    a1:1e:aa:cd:b5:90:ed:a8:8c:87:33:b7:cb:4c:1b:
                    a8:f9:1e:96:ad:94:2b:05:92:0a:d8:5c:84:69:38:
                    1b:f7:ad:e4:be:fa:31:30:e2:0d:32:8f:0b:04:dc:
                    4b:25:80:e9:7c:54:90:f6:59:e3:b4:31:dc:a3:d4:
                    18:78:01:aa:55:25:22:70:01:14:63:5f:7d:ed:b0:
                    4b:50:73:e7:12:65:14:3d:21:62:19:64:f2:35:16:
                    27:15:99:a7:b5:93:9c:41:4a:9f:33:dd:5d:63:13:
                    2d:c4:ea:93:d0:d8:ac:5c:e3:70:fa:e3:89:1a:1b:
                    ce:3a:7a:7c:ac:57:e5:a9:c8:2a:43:5f:76:94:33:
                    b4:1d:b3:a3:87:50:70:ea:52:aa:6e:ac:72:f4:b0:
                    df:fa:2d:c2:ea:f8:97:38:e7:91:53:b1:48:8e:09:
                    6c:39:ec:af:cf:69:89:df:e8:3b:ee:c9:6f:d6:60:
                    c5:bc:7f:9a:12:2e:d8:43:a6:77:75:2c:7a:e6:00:
                    b4:a5:c1:da:7e:e7:d3:4f:19:7c:35:c3:25:f8:20:
                    1e:81
                Exponent: 65537 (0x10001)
        X509v3 extensions:
            X509v3 Authority Key Identifier:
                keyid:5B:D0:8A:1C:9A:32:5B:E0:B5:DD:96:54:1B:E1:86:28:B0:FD:B6:BD
            X509v3 Subject Key Identifier:
                17:80:89:DD:10:68:43:5A:B4:1C:85:82:15:67:CE:47:EC:46:8B:CC
            X509v3 Key Usage: critical
                Digital Signature, Key Encipherment
            X509v3 Basic Constraints: critical
                CA:FALSE
            X509v3 Extended Key Usage:
                TLS Web Server Authentication, TLS Web Client Authentication
            X509v3 Certificate Policies:
                Policy: 1.3.6.1.4.1.6449.1.2.2.29
                Policy: 2.23.140.1.2.1
            X509v3 CRL Distribution Points:
                Full Name:
                  URI:http://crl.usertrust.com/TERENASSLCA2.crl
            Authority Information Access:
                CA Issuers - URI:http://crt.usertrust.com/TERENASSLCA2.crt
                OCSP - URI:http://ocsp.usertrust.com
            X509v3 Subject Alternative Name:
                DNS:www.fh-joanneum.at
    Signature Algorithm: sha256WithRSAEncryption
         8b:c4:83:3b:80:83:bc:f0:5c:d3:7b:fb:43:8c:cb:43:67:65:
         42:a3:85:2f:1d:79:8c:11:75:29:63:41:10:7f:ec:42:4d:f4:
         0b:4e:01:a2:9a:9a:88:b2:5e:5f:da:da:00:4b:22:0d:f4:de:
         ba:1b:6e:8e:72:f5:3a:63:0a:81:52:3a:4b:5f:fe:09:8b:bb:
         6d:44:e2:9f:27:77:c0:fb:8f:9e:9c:5b:f6:7a:30:b7:c5:ad:
         59:5d:5b:df:95:ac:14:04:ad:f2:5d:8f:60:97:96:b3:5d:5d:
         71:db:4f:5b:17:0d:25:58:b3:60:d2:85:46:25:9b:2e:25:04:
         f5:ea:2d:80:ef:58:0b:9d:d0:5f:0f:2f:fe:5f:d5:04:8e:b5:
         58:55:89:18:85:a9:73:b8:7f:ce:40:ad:4e:8f:1b:f2:47:83:
         d8:d5:91:c1:cc:01:51:f1:9a:e9:e8:f6:9e:44:c3:2d:43:88:
         65:9f:98:2f:b7:55:b5:71:32:f4:62:52:61:07:ac:e7:5c:dc:
         98:60:a9:0b:b3:4e:26:b9:9c:7c:70:fb:ff:e4:4e:fa:17:34:
         f4:b4:27:da:0e:38:b6:cc:94:b5:13:90:bb:9f:b4:51:c6:3c:
         48:91:35:38:73:84:48:75:4f:ae:23:66:10:a3:df:75:d7:e5:
         79:8d:cb:4f
$ openssl s_client -connect $HOST:$PORT </dev/null 2>/dev/null|openssl x509 -outform PEM
-----BEGIN CERTIFICATE-----
MIIEnjCCA4agAwIBAgIQNc7Aouh8thXztARBrmGICTANBgkqhkiG9w0BAQsFADBk
MQswCQYDVQQGEwJOTDEWMBQGA1UECBMNTm9vcmQtSG9sbGFuZDESMBAGA1UEBxMJ
QW1zdGVyZGFtMQ8wDQYDVQQKEwZURVJFTkExGDAWBgNVBAMTD1RFUkVOQSBTU0wg
Q0EgMjAeFw0xNTA0MjQwMDAwMDBaFw0xODA1MjEyMzU5NTlaMEAxITAfBgNVBAsT
GERvbWFpbiBDb250cm9sIFZhbGlkYXRlZDEbMBkGA1UEAxMSd3d3LmZoLWpvYW5u
ZXVtLmF0MIIBIjANBgkqhkiG9w0BAQEFAAOCAQ8AMIIBCgKCAQEAqGF39MNqMkmT
SCqVMLm8TDnbJnVI46zDfrahaynWjHaCuT4hWnAQ5oTahfOhHqrNtZDtqIyHM7fL
TBuo+R6WrZQrBZIK2FyEaTgb963kvvoxMOINMo8LBNxLJYDpfFSQ9lnjtDHco9QY
eAGqVSUicAEUY1997bBLUHPnEmUUPSFiGWTyNRYnFZmntZOcQUqfM91dYxMtxOqT
0NisXONw+uOJGhvOOnp8rFflqcgqQ192lDO0HbOjh1Bw6lKqbqxy9LDf+i3C6viX
OOeRU7FIjglsOeyvz2mJ3+g77slv1mDFvH+aEi7YQ6Z3dSx65gC0pcHafufTTxl8
NcMl+CAegQIDAQABo4IBbjCCAWowHwYDVR0jBBgwFoAUW9CKHJoyW+C13ZZUG+GG
KLD9tr0wHQYDVR0OBBYEFBeAid0QaENatByFghVnzkfsRovMMA4GA1UdDwEB/wQE
AwIFoDAMBgNVHRMBAf8EAjAAMB0GA1UdJQQWMBQGCCsGAQUFBwMBBggrBgEFBQcD
AjAiBgNVHSAEGzAZMA0GCysGAQQBsjEBAgIdMAgGBmeBDAECATA6BgNVHR8EMzAx
MC+gLaArhilodHRwOi8vY3JsLnVzZXJ0cnVzdC5jb20vVEVSRU5BU1NMQ0EyLmNy
bDBsBggrBgEFBQcBAQRgMF4wNQYIKwYBBQUHMAKGKWh0dHA6Ly9jcnQudXNlcnRy
dXN0LmNvbS9URVJFTkFTU0xDQTIuY3J0MCUGCCsGAQUFBzABhhlodHRwOi8vb2Nz
cC51c2VydHJ1c3QuY29tMB0GA1UdEQQWMBSCEnd3dy5maC1qb2FubmV1bS5hdDAN
BgkqhkiG9w0BAQsFAAOCAQEAi8SDO4CDvPBc03v7Q4zLQ2dlQqOFLx15jBF1KWNB
EH/sQk30C04BopqaiLJeX9raAEsiDfTeuhtujnL1OmMKgVI6S1/+CYu7bUTinyd3
wPuPnpxb9nowt8WtWV1b35WsFASt8l2PYJeWs11dcdtPWxcNJVizYNKFRiWbLiUE
9eotgO9YC53QXw8v/l/VBI61WFWJGIWpc7h/zkCtTo8b8keD2NWRwcwBUfGa6ej2
nkTDLUOIZZ+YL7dVtXEy9GJSYQes51zcmGCpC7NOJrmcfHD7/+RO+hc09LQn2g44
tsyUtROQu5+0UcY8SJE1OHOESHVPriNmEKPfddfleY3LTw==
-----END CERTIFICATE-----
-----BEGIN CERTIFICATE-----
MIIDqDCCAxGgAwIBAgIJAP/uCjzC9TuMMA0GCSqGSIb3DQEBBQUAMIGUMQswCQYD
VQQGEwJGUjEPMA0GA1UECBMGRnJhbmNlMRQwEgYDVQQHEwtNYWxhdGF2ZXJuZTEP
MA0GA1UEChMGTk9WQVJDMQswCQYDVQQLEwJTSTEYMBYGA1UEAxMPb2NzaW52ZW50
b3J5LW5nMSYwJAYJKoZIhvcNAQkBFhdsYXVyZW50LnBvbnNAbm92YXJjLmNvbTAh
Fw0xMzAzMDYxNDIyMjNaGBAyNjY1NDA1MDUxNDIyMjNaMIGUMQswCQYDVQQGEwJG
UjEPMA0GA1UECBMGRnJhbmNlMRQwEgYDVQQHEwtNYWxhdGF2ZXJuZTEPMA0GA1UE
ChMGTk9WQVJDMQswCQYDVQQLEwJTSTEYMBYGA1UEAxMPb2NzaW52ZW50b3J5LW5n
MSYwJAYJKoZIhvcNAQkBFhdsYXVyZW50LnBvbnNAbm92YXJjLmNvbTCBnzANBgkq
hkiG9w0BAQEFAAOBjQAwgYkCgYEA0Xv40bEDYzAJnjw4DNMicG5QymDb54ddbyA0
JQe4p4c3w8MEz0wS+ZCnxKk7T63KqWpW+ZCXIbLG1yAC/cvH5rFlX3x+gmzJMxLD
dJPd8qrzdPE5ggpbKBp7WPyE/knzYQyJkwILExDgs8jbwMzHDfODYwsrhQ3vWQZq
xy7rDW0CAwEAAaOB/DCB+TAdBgNVHQ4EFgQUTSWRCHBXIn3sEKvKKHy/9TvCXzEw
gckGA1UdIwSBwTCBvoAUTSWRCHBXIn3sEKvKKHy/9TvCXzGhgZqkgZcwgZQxCzAJ
BgNVBAYTAkZSMQ8wDQYDVQQIEwZGcmFuY2UxFDASBgNVBAcTC01hbGF0YXZlcm5l
MQ8wDQYDVQQKEwZOT1ZBUkMxCzAJBgNVBAsTAlNJMRgwFgYDVQQDEw9vY3NpbnZl
bnRvcnktbmcxJjAkBgkqhkiG9w0BCQEWF2xhdXJlbnQucG9uc0Bub3ZhcmMuY29t
ggkA/+4KPML1O4wwDAYDVR0TBAUwAwEB/zANBgkqhkiG9w0BAQUFAAOBgQAXlLHd
20Rwwaij1190mGZFZdjYs2GZWnc7gFymKQiSmFjhrhGb0EG9FTbqGQLW9HzbjNDW
0W4DFHt8GM4Y1miKAja4B09K1pI6+ezLKAvgsBTt6L8lF2dP7s5X4hYVmIQ/J1kN
ZTA2TD2H7FEORYRKmjVX1hvDkgv0+Z7nweM6iQ==
-----END CERTIFICATE----
-----BEGIN CERTIFICATE-----
MIIBoTCCAQqgAwIBAgIIKYcTAgMJNJUwDQYJKoZIhvcNAQEFBQAwEjEQMA4GA1UE
AxMHMC4wLjAuMDAgFw0xNTAxMDQyMzQ0MzNaGA85OTk5MTIzMTIzNTk1OVowEjEQ
MA4GA1UEAxMHMC4wLjAuMDCBnzANBgkqhkiG9w0BAQEFAAOBjQAwgYkCgYEAw+I5
LGtKC4eWYMtkRJiB/1wT4lmg+uyBUrZYpqh/cJv4TsBGIWmZ/eRAAZmLFvCrkOxh
uhgocO5mfnUoo4juIUoKlB532JwRjK0yh5Uhy41/ig9sU3ZrhzjDy25Gu8qrHcp6
KcFoBbRytalpocRNqLwTQz7S/x2G97UlesK9yLcCAwEAATANBgkqhkiG9w0BAQUF
AAOBgQAR/SsXlvOIQR5/nDMPyUS72lI7T2r+lkRk5DJ4ZwiUUHyXHNpGuBqCzDO1
aJF2oHlFHUP1NrmfFncvQdhR3UycNlNDiYr4Ucq173TIhD3yyIGyp/IjIM5Clsxp
65ybl5860OArrL7gQ2HndPp6iSAT0YaoO9kSKBaJb2ev9ndy9g==
-----END CERTIFICATE-----
-----BEGIN CERTIFICATE-----
MIIB2jCCAYQCAQAwDQYJKoZIhvcNAQEEBQAweDELMAkGA1UEBhMCVVMxEDAOBgNV
BAgTB1JhZHdhcmUxEDAOBgNVBAcTB1JhZHdhcmUxFjAUBgNVBAMTDTEwLjEyNS41
My4yMDAxEDAOBgNVBAoTB1JhZHdhcmUxGzAZBgNVBAsTElJhZHdhcmUgd2ViIHNl
cnZlcjAeFw0xMTAxMjcxODQ4MjRaFw0xMTAxMjcxODQ4MjRaMHgxCzAJBgNVBAYT
AlVTMRAwDgYDVQQIEwdSYWR3YXJlMRAwDgYDVQQHEwdSYWR3YXJlMRYwFAYDVQQD
Ew0xMC4xMjUuNTMuMjAwMRAwDgYDVQQKEwdSYWR3YXJlMRswGQYDVQQLExJSYWR3
YXJlIHdlYiBzZXJ2ZXIwXDANBgkqhkiG9w0BAQEFAANLADBIAkEA5CtZ1OldJlPv
GtRR7zQumKkcw6j7Z8xK7omN58x3xlzKJeRduu7ikxlZS/Qk+hYKBXWlq1BQm/nD
Q6l5Jzx7CwIDAQABMA0GCSqGSIb3DQEBBAUAA0EALU/A6Yc1d9q6ftXY4K56XW1s
zVcRKkcLTwFWTfMoY47sJS5IUokmm2NjEE3O1ICbD8L+SA8K72WMd8GEkBVnbw==
-----END CERTIFICATE-----
-----BEGIN CERTIFICATE-----
MIIDvDCCAqQCCQDMT7CxQXVnSzANBgkqhkiG9w0BAQsFADCBnzELMAkGA1UEBhMC
UlUxDDAKBgNVBAgMA1NQYjEMMAoGA1UEBwwDU1BiMR4wHAYDVQQKDBVUZXN0IFNl
bGYgU1NMIENvbXBhbnkxDTALBgNVBAsMBFRlc3QxJTAjBgNVBAMMHHRlc3Qtc2Vs
Zi1zaWduZWQuc3BhY2V3ZWIucnUxHjAcBgkqhkiG9w0BCQEWD3N1cHBvcnRAc3dl
Yi5ydTAeFw0xNjA1MjUxMDA5NDNaFw0xNjA1MjQxMDA5NDNaMIGfMQswCQYDVQQG
EwJSVTEMMAoGA1UECAwDU1BiMQwwCgYDVQQHDANTUGIxHjAcBgNVBAoMFVRlc3Qg
U2VsZiBTU0wgQ29tcGFueTENMAsGA1UECwwEVGVzdDElMCMGA1UEAwwcdGVzdC1z
ZWxmLXNpZ25lZC5zcGFjZXdlYi5ydTEeMBwGCSqGSIb3DQEJARYPc3VwcG9ydEBz
d2ViLnJ1MIIBIjANBgkqhkiG9w0BAQEFAAOCAQ8AMIIBCgKCAQEAsBpOuCvSkxr0
IvRJBdqlbnP+Wlgl4sJV45l5lESKG5oJgeLNIKM/Y9XXVVsb6eg7XtJ7jly3c1zv
0QtRcuuPE1+0VrBZfzF6TSdPlW26+Sg7cOQr4Ts0YI7i/3zbsp9gA4dMbYJ3dNEe
5IbkgjtWvt4XNjsTJcQapgb8nSJiKWpepoWT4WoIrcrS94GMVCNGmgyBvbRfR6to
yOdNIxcQwXK4Qh5lXR/2e8Oto3keECzllbO1VE8AbO317XS69UutKVi6JW/EqbK3
HWSf+jz+G2EJbjEHCZgACuWEl1YB6y8COCahvL+2va4l94cTUR6LUmYxxz9AEj65
gS2uZfD52wIDAQABMA0GCSqGSIb3DQEBCwUAA4IBAQAo+dh4mESNIGwXnq4+Ud6R
rCvS5Hju9SSx1VWSXExT83VmLIoD4j1Nl8nm6GL4FeiFqQ0GELMUHGcmaeThKN9B
7/MresxY6sKUbiMrso8CrNqeaEDBD9fzzMQV+PhjwYFQZhZIumayjKQdrnCaOsRJ
Ubf5uxM4jh7ANKJipkgybQPKp5P0SlJZGxMYkSQhEJoveG2YuEZUBiYW497MtI/j
JVv/c3aGFNz7h66Wv016nVmGXRGHMbsb9iRnQL0BXOKjxB0uGRvHyLcLPWShCSJs
4tGqbacBw6JzDUw4t+aVSO/BeOrS4MId3XeLwkZ+U6ZXQE0ymU2pAkQlh2qUYHJb
-----END CERTIFICATE-----
-----BEGIN CERTIFICATE-----
MIIDijCCAvOgAwIBAgIJAInsHmhpv2KnMA0GCSqGSIb3DQEBBQUAMIGLMQswCQYD
VQQGEwJERTEQMA4GA1UECBMHQmF2YXJpYTEPMA0GA1UEBxMGQW1iZXJnMRUwEwYD
VQQKEwxBU0FNbmV0IGUuVi4xDzANBgNVBAsTBlN5c3RlbTEPMA0GA1UEAxMGU3lz
dGVtMSAwHgYJKoZIhvcNAQkBFhFzeXN0ZW1AYXNhbW5ldC5kZTAeFw0wNzA5MjMx
NjQ5MjlaFw04MTAyMjExMDIxMTNaMIGLMQswCQYDVQQGEwJERTEQMA4GA1UECBMH
QmF2YXJpYTEPMA0GA1UEBxMGQW1iZXJnMRUwEwYDVQQKEwxBU0FNbmV0IGUuVi4x
DzANBgNVBAsTBlN5c3RlbTEPMA0GA1UEAxMGU3lzdGVtMSAwHgYJKoZIhvcNAQkB
FhFzeXN0ZW1AYXNhbW5ldC5kZTCBnzANBgkqhkiG9w0BAQEFAAOBjQAwgYkCgYEA
475BrjWWxhqA9ghkgEYCULXlESdh9Kqf29STHsYkctF0Z2wNxPKx763mdc2XmvHg
GqE08O6Q3JCCjjMwB1zj5V+BQTXOFGobqttuIVjTa6HN/fKZe/ajBKqkYex2imI2
BBVVYmgwcH0v/7QE0QRwK/ZWWpMQsItPk5032qMKXIECAwEAAaOB8zCB8DAdBgNV
HQ4EFgQU11sK9dKYiUZe3tR7vLmpchS1pD8wgcAGA1UdIwSBuDCBtYAU11sK9dKY
iUZe3tR7vLmpchS1pD+hgZGkgY4wgYsxCzAJBgNVBAYTAkRFMRAwDgYDVQQIEwdC
YXZhcmlhMQ8wDQYDVQQHEwZBbWJlcmcxFTATBgNVBAoTDEFTQU1uZXQgZS5WLjEP
MA0GA1UECxMGU3lzdGVtMQ8wDQYDVQQDEwZTeXN0ZW0xIDAeBgkqhkiG9w0BCQEW
EXN5c3RlbUBhc2FtbmV0LmRlggkAieweaGm/YqcwDAYDVR0TBAUwAwEB/zANBgkq
hkiG9w0BAQUFAAOBgQA482el0BBf5AyC22YGNDzo+0LcOCjX7mwUPdp0+rld9E3Q
QBktaY4tW4MLon3/CH1niUivng/oXi6u2+VuMoAzqHbr3kmBPhQQ6gtn+qwm/ljo
FxJrKYbvnEdW+4YTOZGGtc4FyQvQnVwO8cEyogECe0iFtYPt/F6uql8lnljggg==
-----END CERTIFICATE-----
count | % | statustext
----------+---------+--------------------------------------------------------------------
40503588 | 43.647 | timeout
27762510 | 29.917 | ok
15195367 | 16.375 | blocked
3026784 | 3.262 | handshake failed: 5 attempts
2983096 | 3.215 | handshake failed: unknown state
1354009 | 1.459 | handshake failed: unknown protocol
1197553 | 1.290 | handshake failed: socket is not connected
267247 | .288 | wrong algorithm type
251642 | .271 | handshake failed: unsupported protocol
219239 | .236 |
12515 | .013 | handshake failed: sslv3 alert bad record mac
9190 | .010 | handshake failed: wrong version number
6523 | .007 | handshake failed: unable to find public key parameters
3071 | .003 | handshake failed: wrong cipher returned
2328 | .003 | handshake failed: dh key too small
829 | .001 | Invalid certificate data: sbits 0 cert {} chain {}
446 | .000 | handshake failed: data between ccs and finished
415 | .000 | handshake failed: unsupported algorithm
217 | .000 | handshake failed: bad message type
163 | .000 | handshake failed: sslv3 alert handshake failure
145 | .000 | handshake failed: block type is not 01
98 | .000 | handshake failed: unexpected message
77 | .000 | handshake failed: unknown cipher returned
69 | .000 | handshake failed: unable to find ecdh parameters
68 | .000 | handshake failed: bad handshake length
65 | .000 | handshake failed: excessive message size
64 | .000 | handshake failed: broken pipe
53 | .000 | handshake failed: old session cipher not returned
42 | .000 | handshake failed: data length too long
26 | .000 | handshake failed: wrong signature type
24 | .000 | handshake failed: sslv3 alert bad certificate
17 | .000 | handshake failed: header too long
14 | .000 | handshake failed: wrong tag
14 | .000 | handshake failed: sslv3 alert illegal parameter
13 | .000 | handshake failed: invalid utf8string
12 | .000 | handshake failed: wrong signature length
11 | .000 | handshake failed: data too large for modulus
10 | .000 | handshake failed: bad signature
8 | .000 | handshake failed (5):
6 | .000 | handshake failed: too long
6 | .000 | handshake failed: unexpected record
4 | .000 | handshake failed: internal error
4 | .000 | handshake failed: cert length mismatch
4 | .000 | handshake failed: ccs received early
4 | .000 | handshake failed: sslv3 alert certificate unknown
3 | .000 | handshake failed: tlsv1 alert decryption failed
3 | .000 | handshake failed: tlsv1 alert internal error
3 | .000 | handshake failed: connection reset by peer
3 | .000 | handshake failed: unknown digest
3 | .000 | handshake failed: EC lib
3 | .000 | handshake failed: tlsv1 alert access denied
2 | .000 | handshake failed: mstring wrong tag
2 | .000 | handshake failed: sslv3 alert unexpected message
1 | .000 | handshake failed: invalid encoding
1 | .000 | handshake failed: unknown alert type
1 | .000 | data_insert rsa_certs ERROR: null value in column "not_valid_after" violates not-null constraint+
1 | .000 | handshake failed: decryption failed or bad record mac
1 | .000 | handshake failed: point is not on curve
(58 rows)
| count | cipher |
| 17392469 | ECDHE-RSA-AES256-GCM-SHA384 |
| 9969981 | AES256-SHA |
| 8752833 | DHE-RSA-AES256-GCM-SHA384 |
| 7686206 | DHE-RSA-AES256-SHA |
| 4405751 | ECDHE-RSA-AES128-GCM-SHA256 |
| 3113879 | RC4-SHA |
| 2587127 | AES128-SHA |
| 1916487 | AES256-GCM-SHA384 |
| 1650812 | ECDHE-RSA-AES256-SHA384 |
| 1446109 | ECDHE-RSA-AES256-SHA |
| 1063321 | RC4-MD5 |
| 498795 | AES256-SHA256 |
| 439343 | DHE-RSA-AES128-GCM-SHA256 |
| 430165 | DHE-RSA-AES128-SHA |
| 384697 | AES128-SHA256 |
| 270236 | ECDHE-RSA-AES128-SHA256 |
| 196350 | DES-CBC3-SHA |
| 109368 | DHE-RSA-AES256-SHA256 |
| 107022 | ECDHE-RSA-AES128-SHA |
| 106442 | AES128-GCM-SHA256 |
| 54420 | ECDHE-RSA-RC4-SHA |
| 35666 | DHE-RSA-CAMELLIA256-SHA |
| 12599 | EDH-RSA-DES-CBC3-SHA |
| 12370 | DHE-RSA-SEED-SHA |
| 9707 | DES-CBC-SHA |
| 7023 | CAMELLIA256-SHA |
| 5391 | SEED-SHA |
| 5029 | DHE-RSA-AES128-SHA256 |
| 2681 | ECDHE-RSA-DES-CBC3-SHA |
| 2371 | EDH-RSA-DES-CBC-SHA |
| 2281 | DHE-DSS-AES128-SHA |
| 580 | DHE-DSS-AES128-SHA256 |
| 486 | DHE-DSS-AES256-SHA |
| 221 | DHE-DSS-AES256-GCM-SHA384 |
| 195 | DHE-DSS-AES256-SHA256 |
| 131 | DHE-DSS-AES128-GCM-SHA256 |
| 106 | CAMELLIA128-SHA |
| 75 | EDH-DSS-DES-CBC3-SHA |
| 28 | DHE-RSA-CAMELLIA128-SHA |
| 1 | DHE-DSS-CAMELLIA256-SHA |
| # | size | count | # | size | count | # | size | count | # | size | count |
| 1 | 384 | 1 | 49 | 2000 | 1 | 97 | 2548 | 1 | 145 | 4048 | 58 |
| 2 | 511 | 32 | 50 | 2014 | 21 | 98 | 2549 | 1 | 146 | 4056 | 228 |
| 3 | 512 | 37252 | 51 | 2015 | 1 | 99 | 2560 | 23 | 147 | 4065 | 1 |
| 4 | 640 | 1 | 52 | 2018 | 7 | 100 | 2580 | 1 | 148 | 4068 | 4 |
| 5 | 700 | 2 | 53 | 2021 | 3 | 101 | 2922 | 7 | 149 | 4069 | 38 |
| 6 | 768 | 5143 | 54 | 2024 | 84 | 102 | 2948 | 3 | 150 | 4084 | 1 |
| 7 | 1009 | 2 | 55 | 2028 | 33 | 103 | 3000 | 4 | 151 | 4086 | 70 |
| 8 | 1010 | 8 | 56 | 2038 | 3 | 104 | 3024 | 84 | 152 | 4087 | 2 |
| 9 | 1011 | 2 | 57 | 2040 | 25 | 105 | 3027 | 4 | 153 | 4092 | 73 |
| 10 | 1012 | 1 | 58 | 2045 | 3 | 106 | 3042 | 1 | 154 | 4094 | 34 |
| 11 | 1013 | 13 | 59 | 2046 | 14 | 107 | 3047 | 2 | 155 | 4095 | 34 |
| 12 | 1014 | 12 | 60 | 2047 | 6684 | 108 | 3048 | 3 | 156 | 4096 | 654857 |
| 13 | 1015 | 28 | 61 | 2048 | 21381173 | 109 | 3071 | 1 | 157 | 4097 | 8 |
| 15 | 1017 | 165 | 63 | 2050 | 1 | 111 | 3073 | 2 | 159 | 4192 | 3 |
| 16 | 1018 | 175 | 64 | 2054 | 1 | 112 | 3075 | 2 | 160 | 4196 | 27 |
| 17 | 1019 | 245 | 65 | 2056 | 117 | 113 | 3076 | 2 | 161 | 4296 | 1 |
| 18 | 1020 | 501 | 66 | 2057 | 4 | 114 | 3077 | 1 | 162 | 4317 | 1 |
| 19 | 1021 | 972 | 67 | 2058 | 156 | 115 | 3094 | 1 | 163 | 4444 | 2 |
| 20 | 1022 | 1329 | 68 | 2059 | 3 | 116 | 3096 | 33 | 164 | 4567 | 1 |
| 21 | 1023 | 2197 | 69 | 2060 | 1 | 117 | 3098 | 1 | 165 | 4906 | 1 |
| 22 | 1024 | 5751379 | 70 | 2063 | 171 | 118 | 3120 | 3 | 166 | 5000 | 2 |
| 23 | 1025 | 3 | 71 | 2064 | 251 | 119 | 3121 | 1 | 167 | 5012 | 4 |
| 24 | 1027 | 1 | 72 | 2066 | 1 | 120 | 3124 | 1 | 168 | 5096 | 4 |
| 25 | 1028 | 37 | 73 | 2078 | 1 | 121 | 3128 | 4 | 169 | 5098 | 2 |
| 26 | 1029 | 29 | 74 | 2080 | 7 | 122 | 3137 | 1 | 170 | 5120 | 26 |
| 27 | 1030 | 7 | 75 | 2084 | 55 | 123 | 3172 | 2 | 171 | 5192 | 1 |
| 28 | 1034 | 2 | 76 | 2086 | 1 | 124 | 3191 | 1 | 172 | 6096 | 2 |
| 29 | 1039 | 15061 | 77 | 2096 | 53 | 125 | 3192 | 2 | 173 | 6142 | 2 |
| 30 | 1040 | 60708 | 78 | 2148 | 5 | 126 | 3210 | 2 | 174 | 6144 | 16 |
| 31 | 1042 | 10 | 79 | 2160 | 1 | 127 | 3248 | 118 | 175 | 6666 | 1 |
| 32 | 1048 | 15 | 80 | 2176 | 2 | 128 | 3456 | 1 | 176 | 7680 | 1 |
| 33 | 1054 | 1 | 81 | 2222 | 1 | 129 | 3560 | 2 | 177 | 7777 | 1 |
| 34 | 1080 | 1 | 82 | 2240 | 1 | 130 | 3584 | 12 | 178 | 8092 | 1 |
| 35 | 1088 | 1 | 83 | 2248 | 1 | 131 | 3600 | 3 | 179 | 8096 | 19 |
| 36 | 1095 | 1 | 84 | 2270 | 1 | 132 | 3652 | 1 | 180 | 8112 | 1 |
| 37 | 1204 | 2 | 85 | 2272 | 2 | 133 | 3653 | 1 | 181 | 8182 | 1 |
| 38 | 1232 | 103 | 86 | 2291 | 1 | 134 | 3702 | 1 | 182 | 8192 | 1418 |
| 39 | 1234 | 6 | 87 | 2296 | 1 | 135 | 3753 | 1 | 183 | 8196 | 6 |
| 40 | 1248 | 1 | 88 | 2304 | 2 | 136 | 3925 | 1 | 184 | 9128 | 1 |
| 41 | 1280 | 3723 | 89 | 2307 | 1 | 137 | 3931 | 1 | 185 | 9216 | 1 |
| 42 | 1500 | 1 | 90 | 2344 | 1 | 138 | 3966 | 1 | 186 | 10240 | 3 |
| 43 | 1512 | 1 | 91 | 2345 | 3 | 139 | 3968 | 1 | 187 | 15360 | 3 |
| 44 | 1536 | 2863 | 92 | 2393 | 1 | 140 | 3981 | 1 | 188 | 15390 | 1 |
| 45 | 1537 | 1 | 93 | 2400 | 1 | 141 | 4000 | 4 | 189 | 15424 | 1 |
| 46 | 1538 | 1 | 94 | 2408 | 23 | 142 | 4007 | 7 | 190 | 16383 | 1 |
| 47 | 1568 | 1 | 95 | 2432 | 1584 | 143 | 4028 | 3 | 191 | 16384 | 28 |
| 48 | 1800 | 1 | 96 | 2480 | 1 | 144 | 4046 | 13 |
Von: infosec-noreply@caltech.edu [mailto:infosec-noreply@caltech.edu] Gesendet: Donnerstag, 25. Dezember 2014 22:46 An: abuse@a1telekom.at Betreff: 178.189.100.130 blocked at caltech.edu 178.189.100.130 was observed probing caltech.edu for security holes. It has been blocked at our border routers. It may be compromised. For more info contact security@caltech.edu Please include the entire subject line of the original message Greg (time zone of log is PST, which is UTC-0800, date is MMDD) log entries are from Cisco netflow, time is flow start time date time srcIP srcPort dstIP dstPort flags proto #pkts 2014-12-25 12:32:18.589 178.189.100.130 44564 131.215.241.75 443 ....S. 6 1 2014-12-25 12:37:21.459 178.189.100.130 54293 131.215.202.131 443 ....S. 6 1 2014-12-25 12:36:31.549 178.189.100.130 36804 131.215.98.76 443 ....S. 6 1 2014-12-25 12:40:04.613 178.189.100.130 47546 131.215.187.4 443 ....S. 6 1 2014-12-25 12:41:02.651 178.189.100.130 40587 131.215.84.235 443 ....S. 6 1 2014-12-25 12:42:37.618 178.189.100.130 53535 131.215.156.174 443 ....S. 6 1 2014-12-25 12:48:45.579 178.189.100.130 36088 131.215.93.106 443 ....S. 6 1 2014-12-25 12:45:01.630 178.189.100.130 41663 131.215.223.134 443 ....S. 6 1 2014-12-25 12:51:42.502 178.189.100.130 35841 131.215.20.228 443 ....S. 6 1 2014-12-25 12:55:13.506 178.189.100.130 38834 131.215.137.91 443 ....S. 6 1 2014-12-25 12:56:36.495 178.189.100.130 53439 131.215.56.31 443 ....S. 6 1 2014-12-25 12:59:21.481 178.189.100.130 60738 131.215.245.114 443 ....S. 6 1 contact info from: spamcop hosttracker whois contact: abuse@telekom.at
nmap -sP <ALL of your network specifications>
calc_certretr.sh    - extract statistics from retr_cert error log (G.1.1↓)
calc_rsadb.sh       - extract statistics from retr_rsa log files (G.1.4↓)
calc_speed.tcl      - extract statistics from temp. scan files (G.1.2↓)
extract_scanlog.sh  - extract scan speed values from scan log files (G.1.3↓)
show_bannerinfo.sh  - show banner info, type, ftp or all (G.1.5↓)
stats_cpu_det.sh    - statistics about var. CPU usage from top logs (G.1.6↓)
stats_db_group.sh   - table SCAN timed group statistics (G.1.7↓)
stats_db_join.sh    - grouped statistics from db_join log files (G.1.8↓)
stats_grpscan.sh    - grouped values from parscan logfiles (G.1.9↓)
stats_grp_task.sh   - grouped values from task log files (G.1.10↓)
stats_log_vs_db.tcl - ports statistics log filex vs DB values (G.1.11↓)
stats_parscan.sh    - evaluation of the temporary scan files (G.1.12↓)
stats_port_scan.sh  - port statistics from basescan log files (G.1.13↓)
stats_procs.sh      - process statistics from nohup output files (G.1.14↓)
stats_retrieve.sh   - statistics from retrieve_* log files (G.1.15↓)
stats_scanlog.sh    - statistics from scan process log files (G.1.16↓)
stats_sql_rsa.sh    - table RSA_CERTS timed group statistics (G.1.17↓)
stats_single_cpu.sh - CPU statistics from top_numproc log files (G.1.18↓)
stats_xfer.sh       - statistics for openssl retrieve certificate step G.1.19↓
$ sta/calc_certretr.sh -h
Statistics from retrieve cert log files
Error: input file ’-h’ does not exist
Usage: calc_certretr.sh logfile
Available logfiles:
log/retrieve_cert_2016-06-04.elog ...
$ sta/calc_speed.tcl -h
Evaluate scan speed tool 0.2
Usage: sta/calc_speed.tcl [-h] [-t tmpdir] [-p pattern]
 -t .. temp directory, def. ’/dat/d4/ase/master/keyservice/tmp’
 -p .. file pattern, def. ’*’, ’.csv’ is appended
 -d .. do a more detailed analyzation
 -h .. this help text
$ sta/extract_scanlog.sh
Extract scan speed from scan log files
Usage: extract_scanlog.sh log_dir
$ sta/calc_rsadb.sh
Statistics from DB importlog retrieve files
Usage: calc_rsadb.sh [-s] [-a] [-d] [-v] [-t type] [-f from] [-u until] logfiles ..
 -s do not show summary
 -a do not show average
 -d do not show details
 -v show more information
 -t filters records of a specific type
 -f first entry which is used (all or part of in format ’YYYY-MM-DD HH:MM:SS’)
 -u last entry which is used (all or part of in format ’YYYY-MM-DD HH:MM:SS’)
 dblogfiles ’-’ for stdin or files created by log_dbinserts.sh command, available:
log/retrieve_new_2016-06-08.log ...
$ sta/show_bannerinfo.sh
Scanner banner statistics
Usage: show_bannerinfo.sh [--types|--all|--ftp]
sta/stats_cpu_det.sh -h
Detailed statistics from top log files
Usage: stats_cpu_det.sh [-s {0|1}] [-c {0|1}] [-p {0|1}] [file ..]
 -h or --help - this usage message
 -s .. cpu mode (def. 1)
 -c .. summary mode (def. 0)
 -p .. process mode (def. 0)
 -f .. top file to analyze (def. top_2016-06-07_numproc_48_3.out)
$ sta/stats_db_group.sh -h
Extract grouped values from table SCAN - 0.3
Usage: stats_db_group.sh [-h] [-o outfile] [-d database] [-S|-M|-H|-D] start until
  -o .. specify output file (def. stdout)
  -d .. specify database (def. ’oldservice’)
  -f .. group list by seconds
  -M .. group list by minutes (default)
  -H .. group list by hours
  -D .. group list by days
  start, until must be in format ’YYYY-MM-DD HH:MM:SS’
$ sta/stats_db_join.sh -h
Extract statistics from db_join log files
usage: stats_db_join.sh [-t tmp_log] [-s] [-d] [-M|-H|-S] [-b begin_time] [-e end_time]
 -t .. define tmp_log dir, default is: sta/../log
 -s .. supress summary information
 -d .. show detailed information
 -H .. show hour group CSV values
 -M .. show minute group CSV values
 -S .. show second group CSV values
 begin_time, end_time must be in format: YYYY-MM-DD HH-MM-SS
$ sta/stats_grpscan.sh -h
Extract grouped values from parscan logfiles
Usage: stats_grpscan.sh [-h] [-f|-S|-M|-m|-H|-d] [scan_options]
  -f .. group list by seconds
  -S .. group list by 10 seconds
  -M .. group list by minutes (default)
  -m .. group list by 10 minutes
  -H .. group list by hours
  -d .. group list by days
Possible scan_options are:
  usage: stats_parscan.sh [-t tmp_log] [-s] [-d] [-b begin_time] [-e end_time]
  -t .. define tmp_log dir, default is: sta/../log/other_ports
  -d .. supress detailed information
  -s .. supress summary information
  begin_time, end_time must be in format: YYYY-MM-DD HH-MM-SS
$ sta/stats_grp_task.sh -h
Extract grouped values from task log files
Usage: stats_grp_task.sh [-h] [-f|-S|-M|-m|-H|-d] [file_pat]
  -f .. group list by seconds
  -S .. group list by 10 seconds
  -M .. group list by minutes (default)
  -m .. group list by 10 minutes
  -H .. group list by hours
  -d .. group list by days
$ sta/stats_parscan.sh --help
usage: stats_parscan.sh [-t tmp_log] [-s] [-d] [-b begin_time] [-e end_time]
 -t .. define tmp_log dir, default is: log/other_ports
 -d .. supress detailed information
 -s .. supress summary information
 begin_time, end_time must be in format: YYYY-MM-DD HH-MM-SS
$ sta/stats_port_scan.sh -h
Port statistics from basescan log files
Usage: stats_port_scan.sh [-h] [-q] [-a|-S|-M|-m|-H|-d] [-t tempdir] [file_pat]
  -a .. output all service records
  -S .. group list by seconds
  -M .. group list by minutes (default)
  -H .. group list by hours
  -d .. group list by days
  -q .. no output, only summary
  -t .. specify other temp dir (def. sta/../tmp)
  default file pattern is: basescan_all.out
$ sta/stats_procs.sh -h
Extract process statistics from nohup output files
usage: stats_procs.sh [date_pattern]
  -b .. begin date
  -e .. end date
 begin and end date must match format: YYYY-MM-DD HH-MM-SS
$ sta/stats_retrieve.sh -h
Statisics from retrieve log files
Usage: stats_retrieve.sh logfiles
sta/../log/retrieve_new_2016-06-08.log
...
$ sta/stats_scanlog.sh -h
Statistics from scan process log files
usage: stats_scanlog.sh [-t tmp_log] [-p pattern]
default tmp_log is: sta/../log
$ sta/stats_sql_rsa.sh -h
RSA_CERTS DB grouped statistics
Error: missing time period grouping value (must be D, H, M or S)
Usage: stats_sql_rsa.sh {D|H|M|S} [extra]
  Average values of Days, Hours, Minutes and Seconds of scanned RSA certificates.
  If the extra parameter is specified only succesful retrieved certificates are counted.
  Evaluation range is from ’2016-06-04 18:34:04’ until ’2016-06-15 15:45:43’.
$ sta/stats_single_cpu.sh -h
Statistics for each single CPU from top_numproc log files
Missing logfile paramaters
Usage: stats_single_cpu.sh logfiles
sta/../log/top_2016-06-05_numproc_48_0.out
...
GraphManager.tcl - simple management tool for creating charts
data             - subdirectory for various GraphManager input data files
modules          - subdirectory containing GraphManager modules
[1] . The Secure Sockets Layer (SSL) Protocol Version 3.0. RFC Editor, 2011. URL http://www.rfc-editor.org/rfc/rfc6101.txt.
[2] . PgTune - Configuration calculator for PostgreSQL. 2013. URL http://pgtune.leopard.in.ua/.
[3] . La cryptographie militaire. Journal des sciences militaires, IX:5-83, 1883. URL https://en.wikipedia.org/wiki/Kerckhoffs.
[4] . Bundesgesetz über den Schutz personenbezogener Daten (Datenschutzgesetz 2000 - DSG 2000). 1999. URL https://www.ris.bka.gv.at/GeltendeFassung.wxe?Abfrage=bundesnormen&Gesetzesnummer=10001597.
[5] . Kryptographische Verfahren: Empfehlungen und Schlüssellängen. BSI - Technische Richtlinie, BSI TR-02102-1(2016-01), 2016.
[6] . Faktorisierung großer Zahlen. Spektrum der Wissenschaft, , (September 1994):80., 1994. Spektrum der Wissenschaft Verlagsgesellschaft mbH.
[7] . Internet X.509 Public Key Infrastructure Certificate and Certificate Revocation List (CRL) Profile. RFC Editor, 2008. URL http://www.rfc-editor.org/rfc/rfc5280.txt.
[8] . Transport Layer Security (TLS) Extensions: Extension Definitions. RFC Editor, 2011. URL http://www.rfc-editor.org/rfc/rfc6066.txt.
[9] . Factoring into coprimes in essentially linear time. Journal of Algorithms, 54:1-30, 2005. URL http://cr.yp.to/papers.html#dcba.
[10] . PostgreSQL. 2016. URL https://www.postgresql.org/.
[11] . Analysis of the HTTPS Certificate Ecosystem. Proc. IMC:291—304, 2013. URL http://doi.acm.org/10.1145/2504730.2504755.
[12] . Nmap Network Scanning. Insecure.Com LLC, aug 2011. URL https://nmap.org/book/man-port-scanning-techniques.html. ISBN 978-0-9799587-1-7 | ISBN-100-9799587-1-7.
[13] . The Mathematics of Public-Key Cryptography. Scientific American, (August 1979):146-157, 1979.
[14] . Empirical analysis of Public Key Infrastructures and Investigation of Improvements. 2014. URL https://mediatum.ub.tum.de/download/1182735/1182735.pdf.
[15] . Information technology - Open Systems Interconnection - Network service definition. 2002. URL http://www.iso.org/iso/iso_catalogue/catalogue_tc/catalogue_detail.htm?csnumber=35872.
[16] . Information technology - ASN.1 encoding rules: Specification of Basic Encoding Rules (BER), Canonical Encoding Rules (CER) and Distinguished Encoding Rules (DER). 2015. URL http://www.itu.int/rec/T-REC-X.690-201508-I.
[17] . Public-Key Cryptography Standards (PKCS) #1: RSA Cryptography Specifications Version 2.1. RFC Editor, 2003. URL http://www.rfc-editor.org/rfc/rfc3447.txt.
[18] . Privacy Enhancement for Internet Electronic Mail: Part I: Message Encryption and Authentication Procedures. RFC Editor, 1993. URL https://tools.ietf.org/rfcmarkup?doc=1421.
[19] . Internet Control Message Protocol. RFC Editor, 1981. URL http://www.rfc-editor.org/rfc/rfc792.txt.
[20] . Broadcasting Internet Datagrams. RFC Editor, 1984. URL http://www.rfc-editor.org/rfc/rfc919.txt.
[21] . Network Security with OpenSSL, Cryptography for Secure Communications. O'Reilly Media Final Release, June 2002 2002. Ebook ISBN: 978-0-596-10345-3 | ISBN 10: 0-596-10345-X.
[22] . Transmission Control Protocol. RFC Editor, 1981. URL http://www.rfc-editor.org/rfc/rfc793.txt.
[23] . WHOIS Protocol Specification. RFC Editor, 2004. URL http://www.rfc-editor.org/rfc/rfc3912.txt.
[24] . General system theory: Essays on its foundation and development. New York: George Braziller, 1968.
[25] . Internet X.509 Public Key Infrastructure Certificate and Certificate Revocation List (CRL) Profile. RFC Editor, 2002. URL http://www.rfc-editor.org/rfc/rfc3280.txt.
[26] . The Transport Layer Security (TLS) Protocol Version 1.2. RFC Editor, 2008. URL http://www.rfc-editor.org/rfc/rfc5246.txt.
[27] . The GNU Multiple Precision Arithmetic Library. 2014. URL https://gmplib.org/gmp-man-6.0.0a.pdf.
[28] . Address Allocation for Private Internets. RFC Editor, 1996. URL http://www.rfc-editor.org/rfc/rfc1918.txt.
[29] . A Search Engine Backed by Internet-Wide Scanning. Proceedings of the 22nd ACM Conference on Computer and Communications Security, 2015. URL https://www.censys.io/.
[30] . ZMap: Fast Internet-Wide Scanning and its Security Applications. Proceedings of the 22nd USENIX Security Symposium, 2013.
[31] . ZMap: Fast Internet-wide Scanning and Its Security Applications. Presented as part of the 22nd USENIX Security Symposium (USENIX Security 13):605—620, 2013. URL https://www.usenix.org/conference/usenixsecurity13/technical-sessions/paper/durumeric.
[32] . Internet-Wide Scan Data Repository Internet-Wide Scan Data Repository Internet-Wide Scan Data Repository . 2014. URL https://zakird.com/.
[33] . Parsing X.509 Certificates with OpenSSL and CCVE-2014-0160. 2013. URL https://zakird.com/2013/10/13/certificate-parsing-with-openssl.
[34] . CVE-2014-0160. 2013. URL https://cve.mitre.org/cgi-bin/cvename.cgi?name=cve-2014-0160.